![]() Norm Winski
Norm Winski
Independent Analyst
Recap 9/21 – The S&P opened with a 15 handle gap up and then traded in a narrow sideways trading range culminating with a high at 1:59 PM, just ahead of the Fed policy announcement. From that high, the S&P declined 68 handles into a 2:05 PM low. From that low, the S&P rallied 88 handles into a 2:46 PM high of the day. From that high, the S&P declined 117 handles into the close.
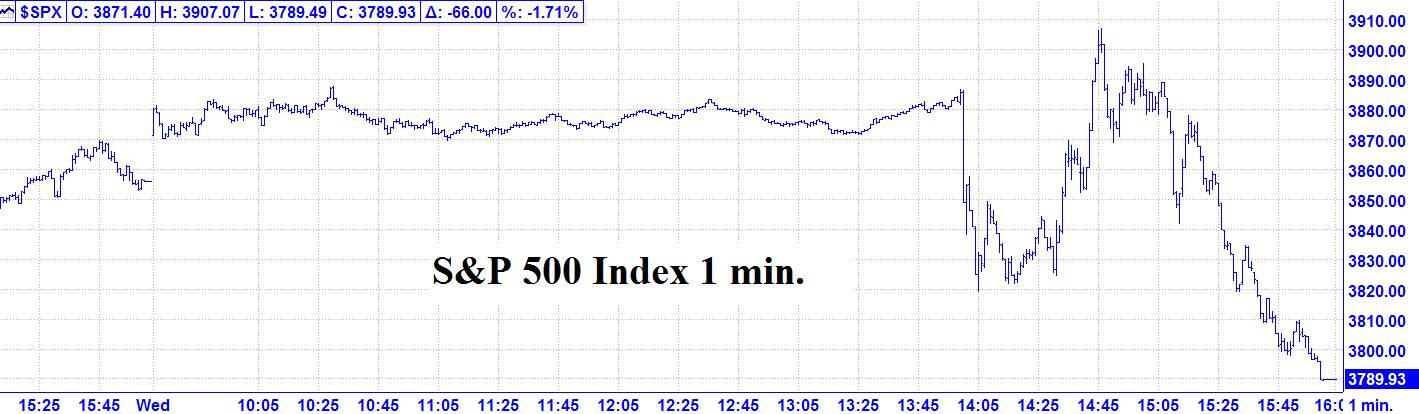
9/21 – The major indices, coinciding with the Fed policy announcement, had a huge whipsaw day, ending with a large down day to finish per the following closes: DJIA - 522.45; S&P 500 - 66.00; and the Nasdaq Comp. - 204.86.
Looking ahead – Our next major change in trend point is a 9/23 AC Full Moon. Additionally, we have two other points to consider:
DJIA – 9/22 and Fibonacci – 9/23. Please see details below
The Astro picture is relatively quiet this week.
Please see details below.
The Now Index has moved back to the NEUTRAL ZONE.
Coming events
(Stocks potentially respond to all events).
2 G. 9/23 AC – New Moon in Libra. Major change in trend Financials, Grains, Precious Metals, Sugar, Wheat.
3. A. 9/26 AC – Moon’s North Node Contra-Parallel US Moon. Major change in trend US Stocks, T-Bonds, US Dollar.
B. 9/28 AC – Jupiter 45 Uranus. Moderate change in trend Cattle, Copper, Cotton, Oats.
C. 9/29 AC – Moon’s North Node Contra-Parallel US Saturn. Major change in trend US Stocks, T-Bonds, US Dollar.
D. 9/30 AC – Jupiter 45 US Moon. Moderate change in trend US Stocks, T-Bonds, US Dollar.
E. 9/30 AC – Mercury in Virgo turns Direct. Major change in trend Corn, Oats, SOYBEANS, Wheat.
F. 9/30 AC – Mercury 0 North Latitude. Major change in trend Corn, Oats, Soybeans, Wheat.
G. 10/03AC – Saturn Parallel US Moon. Major change in trend US Stocks, T-Bonds, US Dollar.
Market math
9/30 = 5,468 (Music) days > 10/11/2007 MAJOR HIGH.
Fibonacci – 9/23, 9/27.
*DJIA – 9/22, 9/27.
*NYSE – 9/26.
Astro – 9/26, 9/27, *9/30 AC.
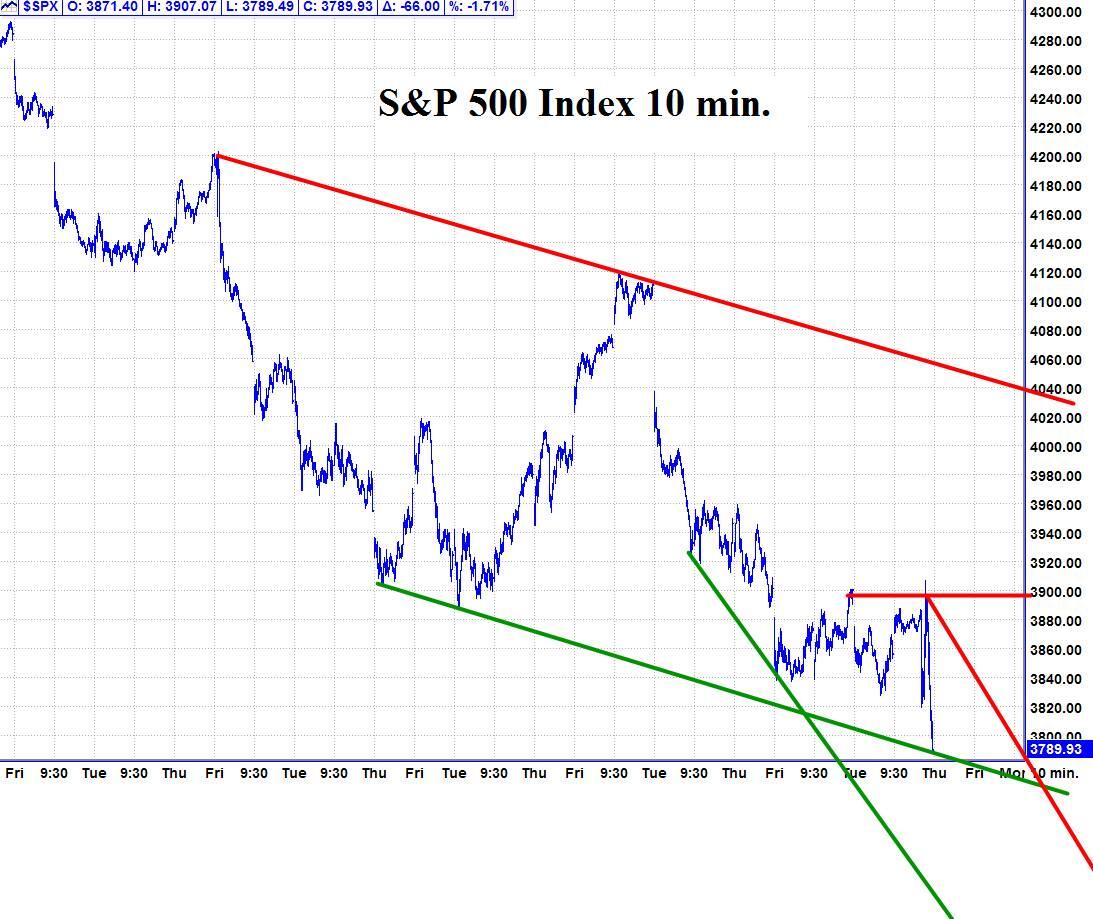
Please see below the S&P 500 10 minute chart.
Support - 3780, 3720 Resistance – 3860, 3910.
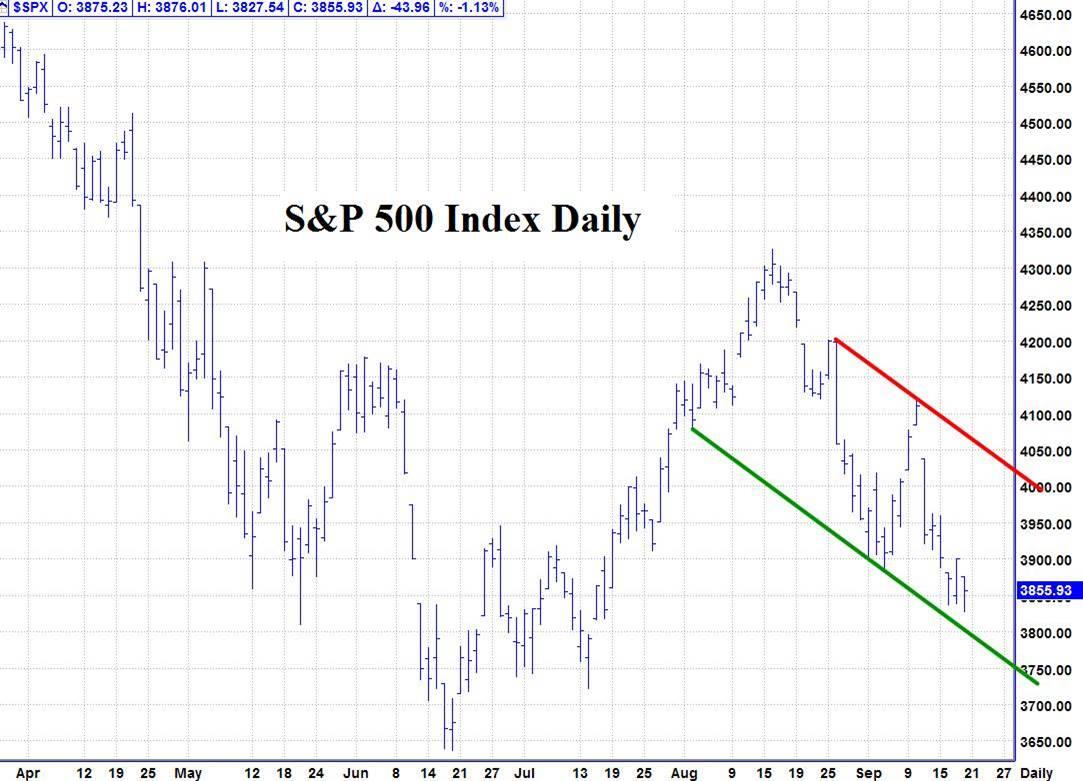
Please see below the S&P 500 Daily chart.
Support - 3780, 3720 Resistance – 3860, 3910.
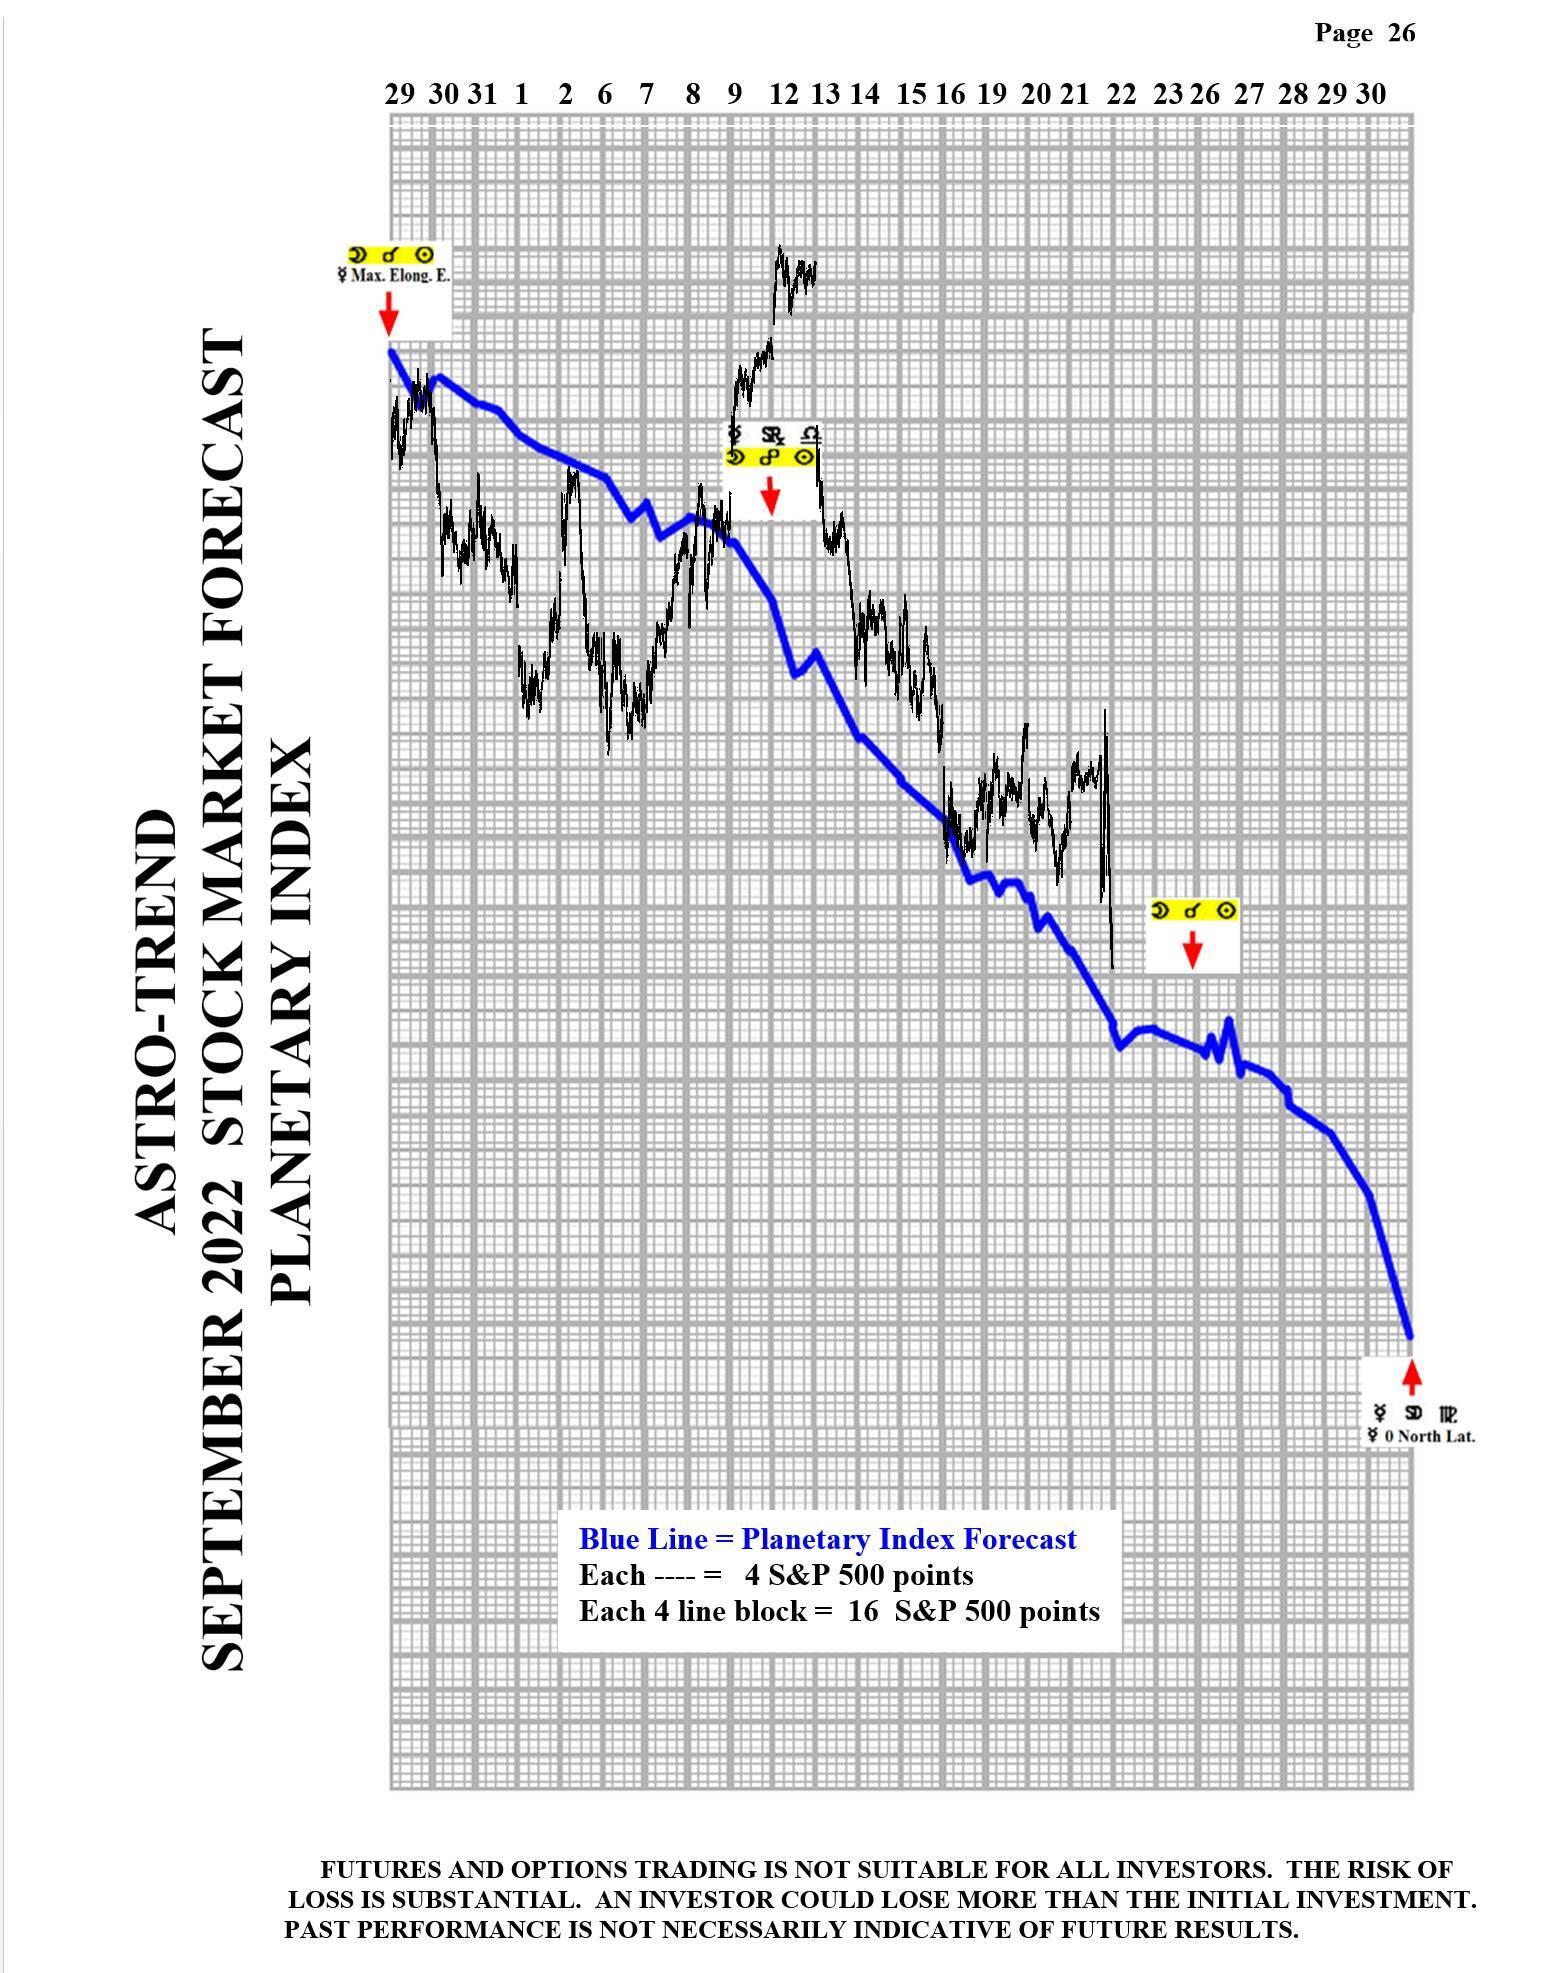
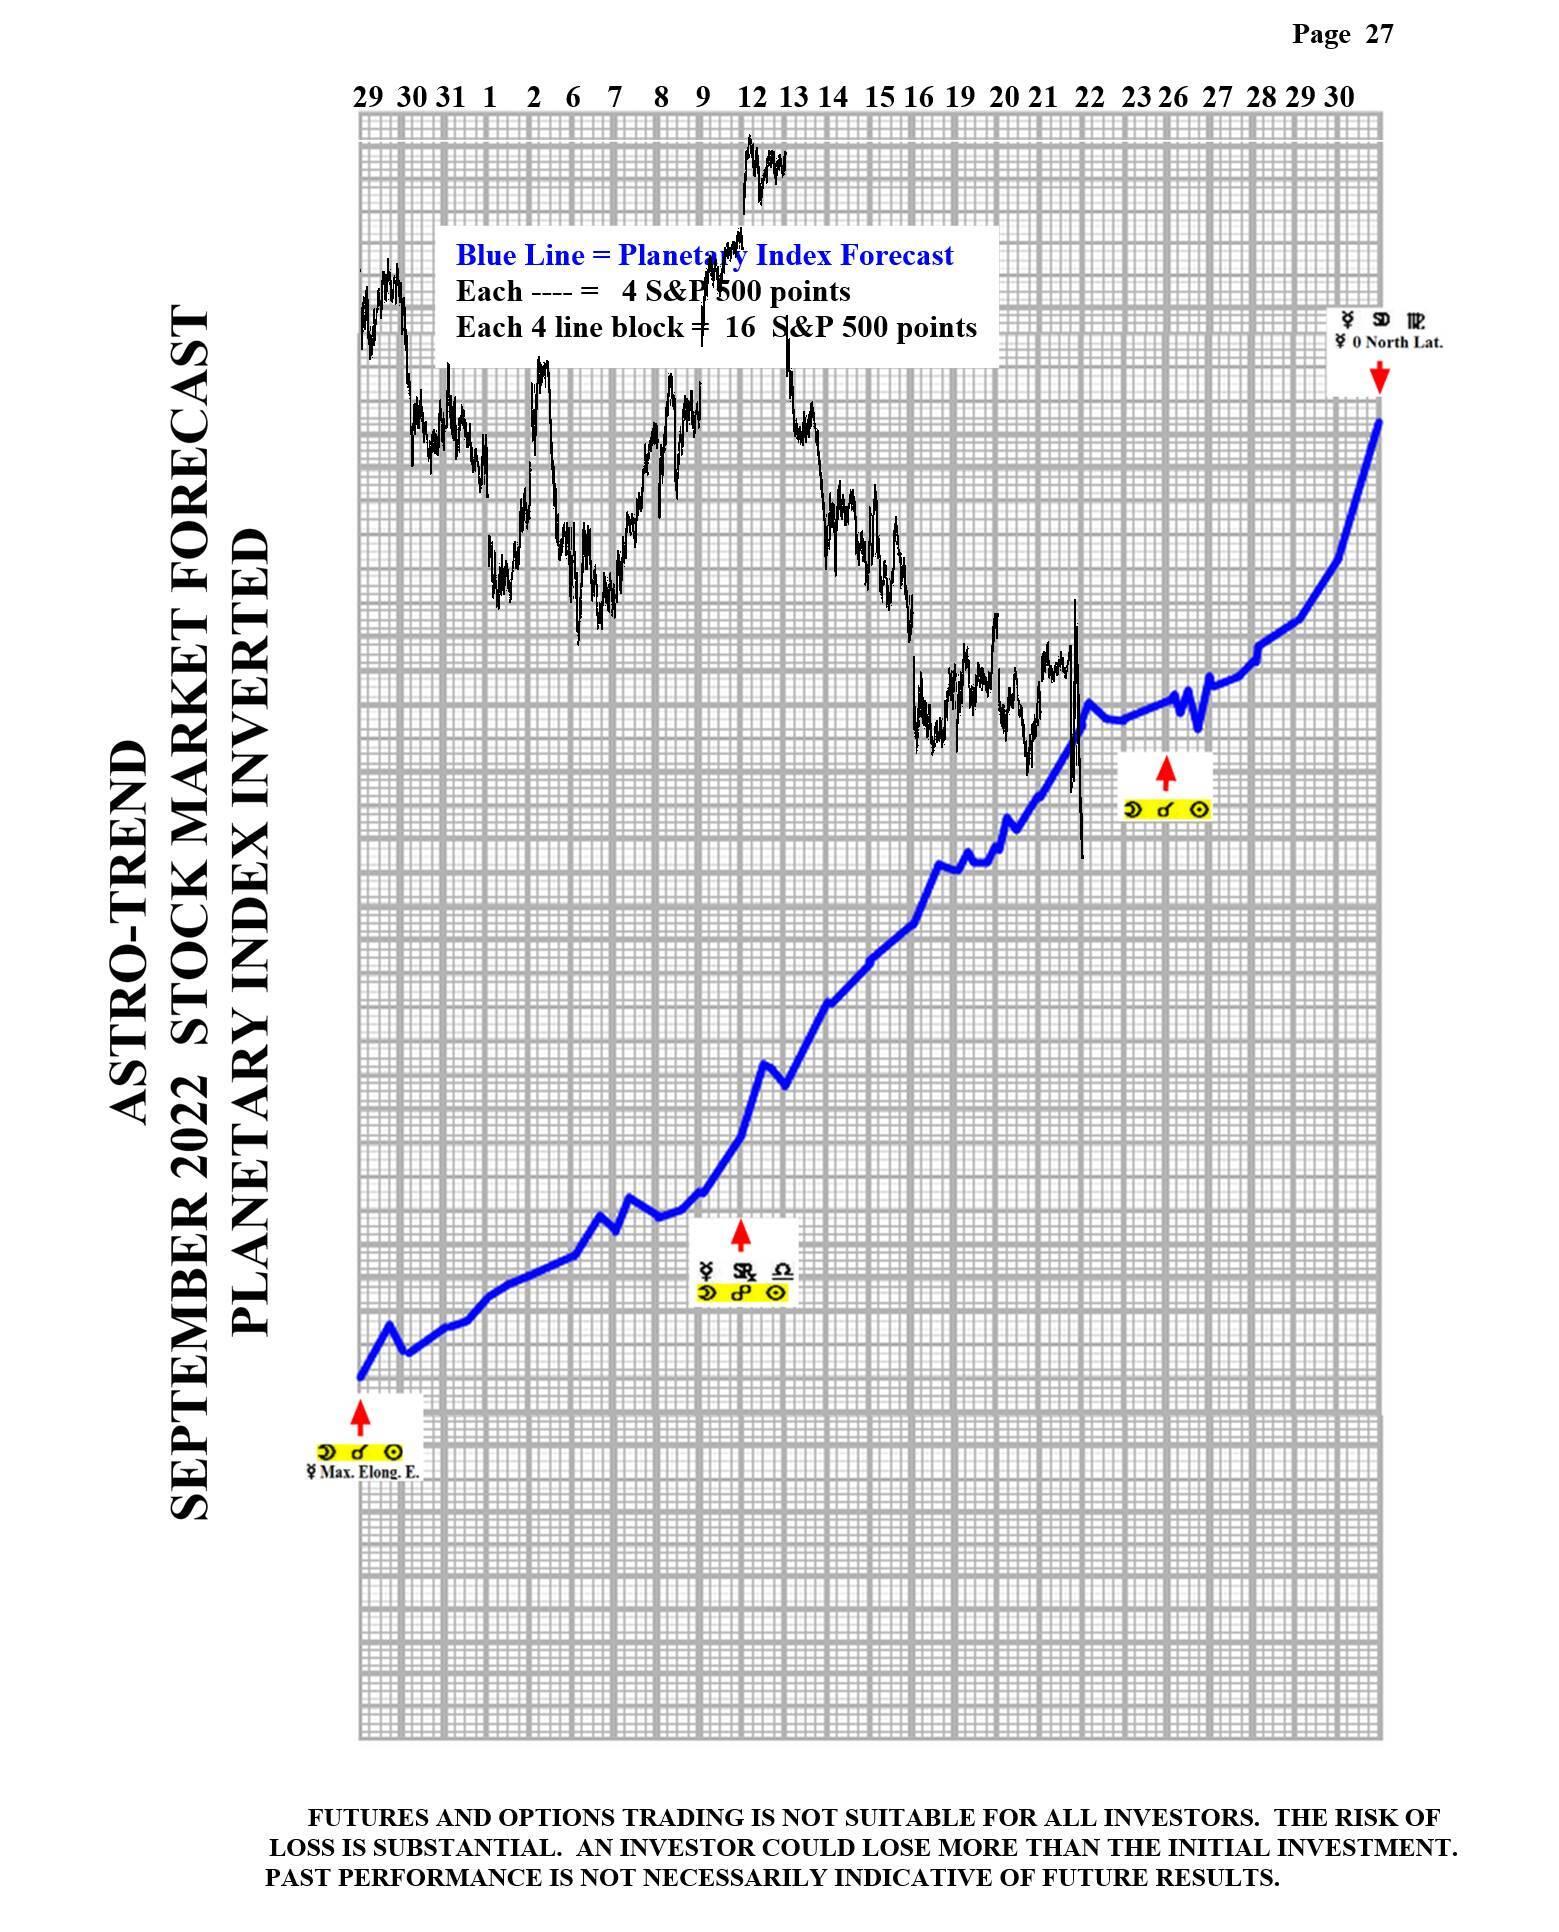
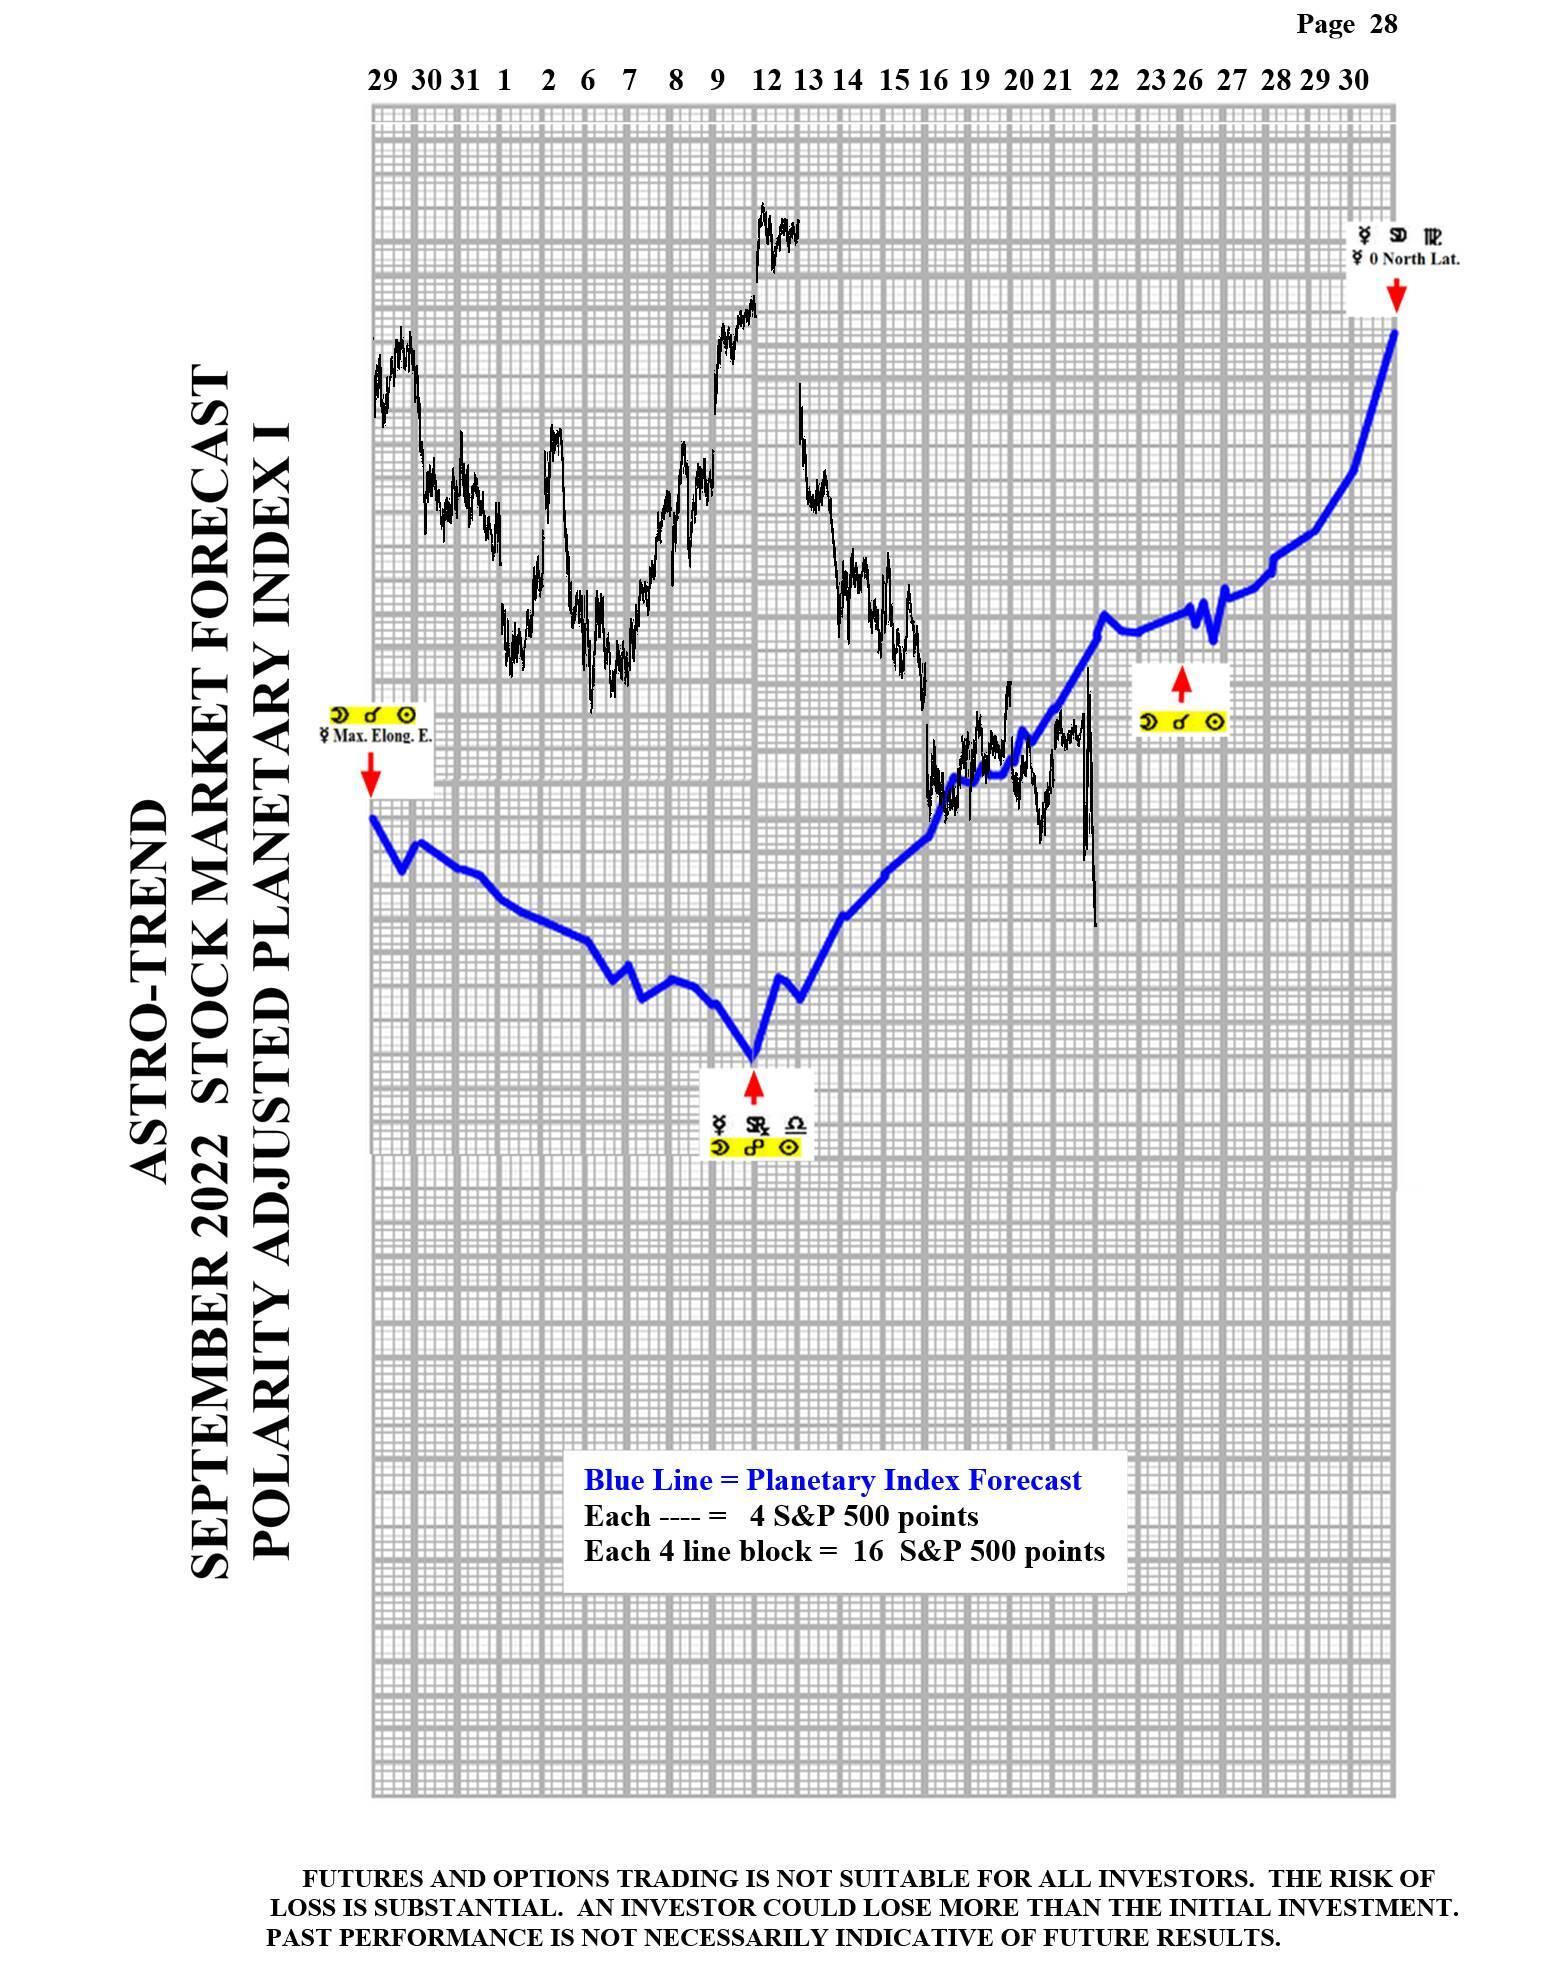
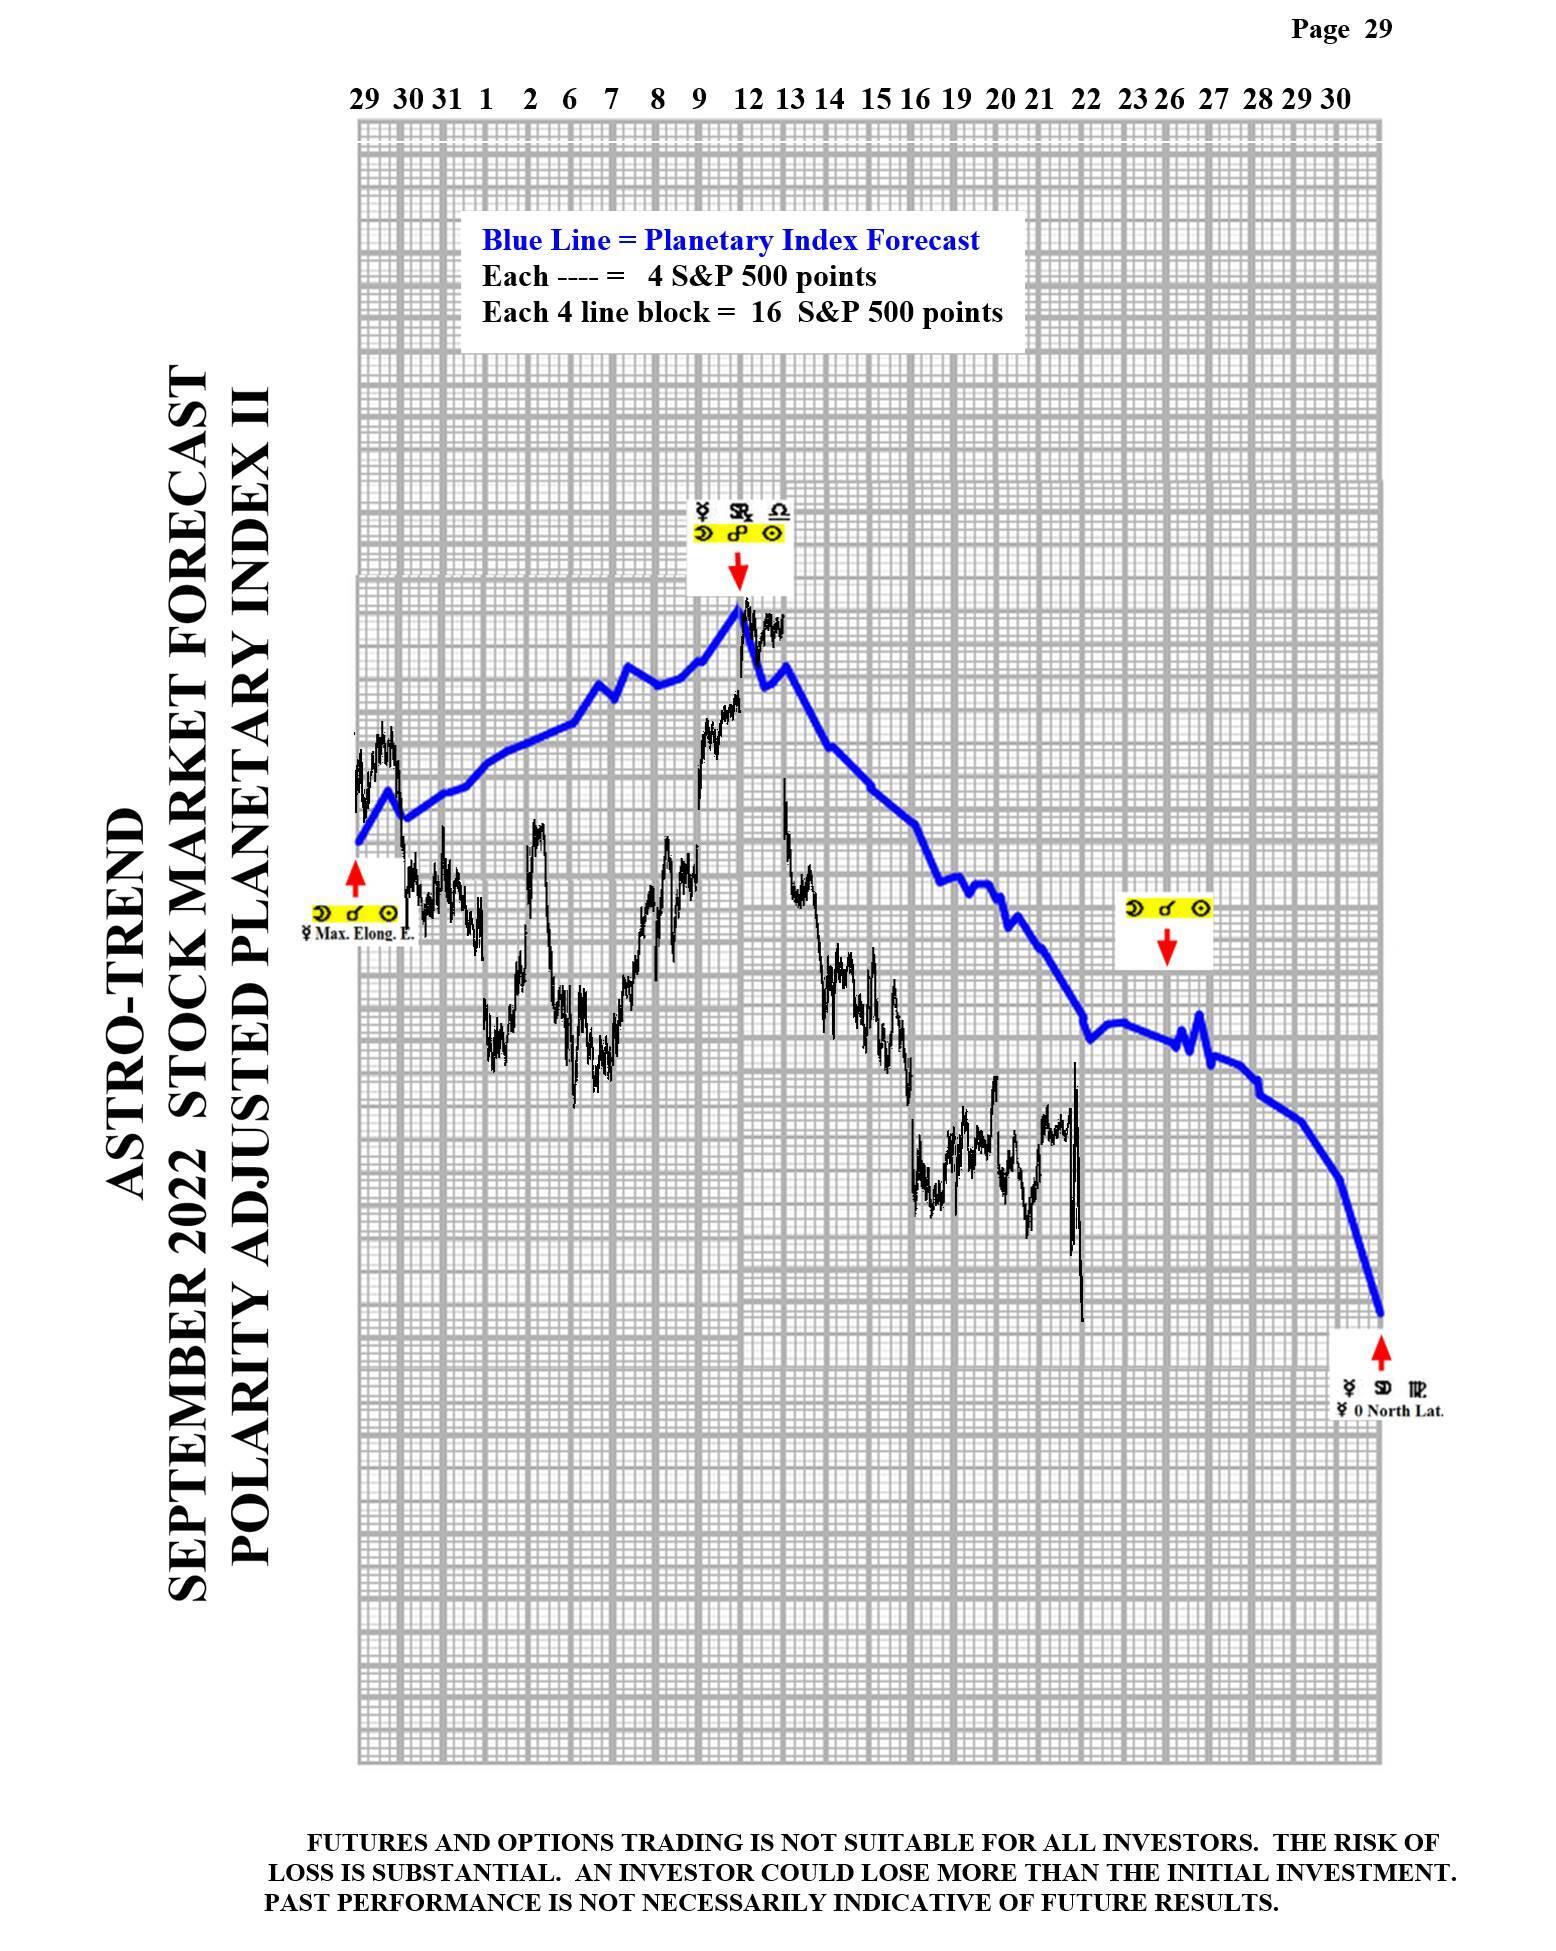
Please see below the September Planetary Index charts with S&P 500 10 minute bars for results.
Note: All information on this page is subject to change. The use of this website constitutes acceptance of our user agreement. Please read our privacy policy and legal disclaimer. Opinions expressed at FXstreet.com are those of the individual authors and do not necessarily represent the opinion of FXstreet.com or its management. Risk Disclosure: Trading foreign exchange on margin carries a high level of risk, and may not be suitable for all investors. The high degree of leverage can work against you as well as for you. Before deciding to invest in foreign exchange you should carefully consider your investment objectives, level of experience, and risk appetite. The possibility exists that you could sustain a loss of some or all of your initial investment and therefore you should not invest money that you cannot afford to lose. You should be aware of all the risks associated with foreign exchange trading, and seek advice from an independent financial advisor if you have any doubts.
Recommended Content
Editors’ Picks
EUR/USD clings to daily gains above 1.0650

EUR/USD gained traction and turned positive on the day above 1.0650. The improvement seen in risk mood following the earlier flight to safety weighs on the US Dollar ahead of the weekend and helps the pair push higher.
GBP/USD recovers toward 1.2450 after UK Retail Sales data

GBP/USD reversed its direction and advanced to the 1.2450 area after touching a fresh multi-month low below 1.2400 in the Asian session. The positive shift seen in risk mood on easing fears over a deepening Iran-Israel conflict supports the pair.
Gold holds steady at around $2,380 following earlier spike

Gold stabilized near $2,380 after spiking above $2,400 with the immediate reaction to reports of Israel striking Iran. Meanwhile, the pullback seen in the US Treasury bond yields helps XAU/USD hold its ground.
Bitcoin Weekly Forecast: BTC post-halving rally could be partially priced in Premium

Bitcoin price shows no signs of directional bias while it holds above $60,000. The fourth BTC halving is partially priced in, according to Deutsche Bank’s research.
Week ahead – US GDP and BoJ decision on top of next week’s agenda

US GDP, core PCE and PMIs the next tests for the Dollar. Investors await BoJ for guidance about next rate hike. EU and UK PMIs, as well as Australian CPIs also on tap.