![]() Kaye Lee
Kaye Lee
Straight Talk Trading
A week after the Dow’s historic rise to break the 20000 level, the question is where it will be able to sustain this movement. Although technical methods are reporting different views, there is a strong case for anticipating some profit-taking and pullback activity in the near future. The first clue of this lies in the fact that it remained above that level for only a very short period, as shown in Figure 1.
Figure 1: The Dow Retests the 20000 Level from Above but Breaks Below
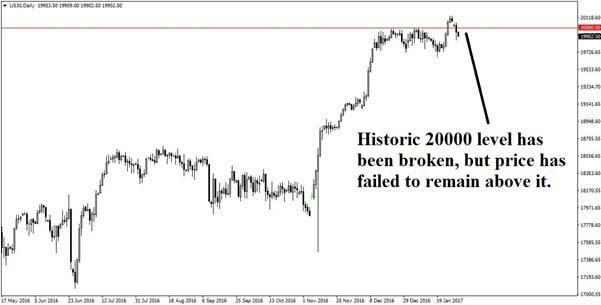
Traditionally, a breakout from such a major level of resistance is considered to have succeeded if price remains above it for a sustained amount of time, or if a retest of it from above results in a rebound higher. This has not been the case this time, which suggests that the initial breakout was temporary, at least at this point. The question is, how far down could it go?
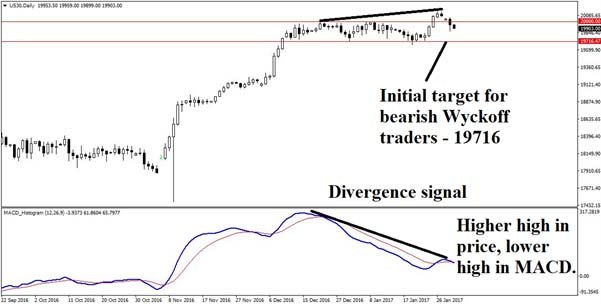
There are several views of this. One is that this is what constitutes a Wyckoff upthrust setup, with a false breakout, which is thus now expected to head down to the lows of the previous, tight consolidation, as shown in Figure 2. This is also supported by the fact that the higher high in price was accompanied by a lower high in momentum oscillators, notably the MACD. This is classified as a reversal divergence signal. Alone, it would not be particularly alarming, but the fact that the upthrust setup is also in place increases the bearish significance of the circumstances.
The essence of the divergence signal is that a rise in price has not been confirmed by an increase in momentum. This generally signifies a slowing of the trend, although it would be precipitate to assume that it has run its course simply because of this one sign. Often, divergences lead to pauses in the trend prior to a continuation. This could well prove to be the case in this situation, as there are no particularly significant statistical resistance levels in this zone. Thus, pending further data, it appears that the case is only for a retracement at this stage, and not a collapse.
Figure 2: Wyckoff Upthrust and MACD Reversal Divergence Reveal Hidden Weakness
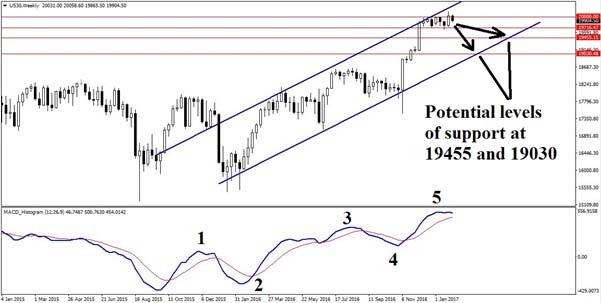
To continue with the question of how far this retracement could go, one could turn to the weekly chart. Here, we see very strong momentum in the price trend, as it has risen to challenge the top of the parallel channel. However, an Elliott wave count of the MACD shows that a wave 5 may well be present. A MACD wave count of that sort suggests that prices should experience a significant slowing in momentum in the near (multi-week) future. Should prices decline beyond the initial daily Wyckoff support, then the channel will be the next line of defence, with two possible levels of interest as denoted in Figure 3.
Figure 3: Wyckoff Upthrust and MACD Reversal Divergence Reveal Hidden Weakness
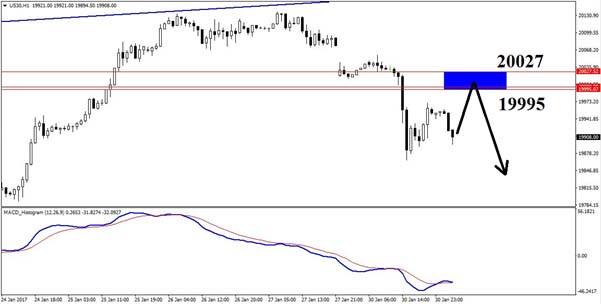
What about traders who wish to enter aggressively against the major trend? Bearing in mind the dictum that it is usually unwise to fight a major uptrend, it would be a better move to look for an entry close to the 20000 resistance level on a lower timeframe. In this case, the hourly chart may
prove to be of interest. The statistical Blue Box zone for a potential short, should price rise to that area and provide an appropriate trigger in accordance with traders’ rules, has been identified in Figure 4 below.
Figure 4: Hourly Dow Potential Blue Box Resistance
As always, do bear in mind that countertrend trading requires much greater niftiness than trend trading, and act accordingly.
RISK DISCLOSURE: Trading foreign exchange (FX) and contracts for difference (CFD) on margin carries a high level of risk and may not be suitable for all investors. The high degree of leverage can work against you as well as for you. Before deciding to invest in FX or CFDs you should carefully consider your investment objectives, level of experience and risk appetite. The possibility exists that you could sustain a loss of some or all of your initial investment and therefore you should not invest money that you cannot afford to lose. You should be aware of all the risks associated with leveraged trading and seek advice from an independent financial advisor if you have any doubts.
Recommended Content
Editors’ Picks
EUR/USD clings to daily gains above 1.0650

EUR/USD gained traction and turned positive on the day above 1.0650. The improvement seen in risk mood following the earlier flight to safety weighs on the US Dollar ahead of the weekend and helps the pair push higher.
GBP/USD recovers toward 1.2450 after UK Retail Sales data

GBP/USD reversed its direction and advanced to the 1.2450 area after touching a fresh multi-month low below 1.2400 in the Asian session. The positive shift seen in risk mood on easing fears over a deepening Iran-Israel conflict supports the pair.
Gold holds steady at around $2,380 following earlier spike

Gold stabilized near $2,380 after spiking above $2,400 with the immediate reaction to reports of Israel striking Iran. Meanwhile, the pullback seen in the US Treasury bond yields helps XAU/USD hold its ground.
Bitcoin Weekly Forecast: BTC post-halving rally could be partially priced in Premium

Bitcoin price shows no signs of directional bias while it holds above $60,000. The fourth BTC halving is partially priced in, according to Deutsche Bank’s research.
Week ahead – US GDP and BoJ decision on top of next week’s agenda

US GDP, core PCE and PMIs the next tests for the Dollar. Investors await BoJ for guidance about next rate hike. EU and UK PMIs, as well as Australian CPIs also on tap.