![]() Andre Gratian
Andre Gratian
Market Turning Points
Point and Figure Overview of SPX
Long-term trend: The bull market which started in 03/09 shows no sign of having run its course. A rough count taken on the long-term Point & Figure chart gives us a potential targettoas high as 4080. P&F does not predict time, only price.(no change)
Intermediate trend: After forming a congestion pattern at 3240, SPX has pushed a little higher. The pattern suggests 3280 (which has already been reached) to 3300. This is in accord with the long-term chart (3X10) which projects these levels as the next target if 3240 does not contain the advance. This wasmentioned as a possibility in a former Newsletter.
Market Analysis (All charts are courtesy of QChart)
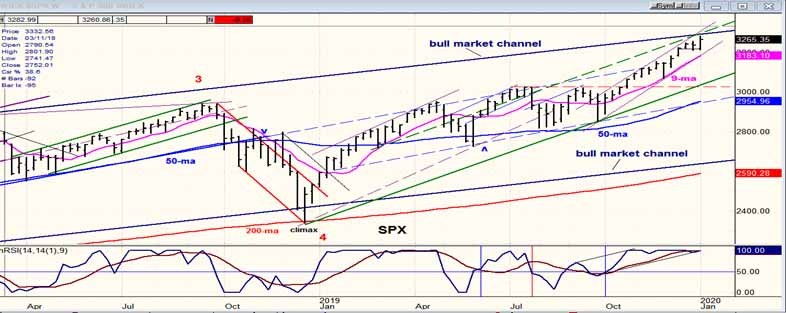
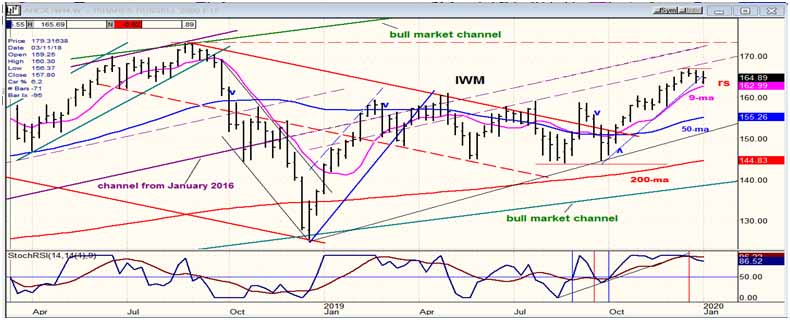
SPX-IWM weekly charts
Another week, another new high – for SPX! Not so for IWM which has refused to follow for the second consecutive week, thereby enhancing its relative weakness. Past experience has taught us what that means: a top is close!
As mentioned in the P&F section, SPX has a good possibility of reaching 3300 before this steady uptrend comes to an end. My target date is around January 15, which is next week!
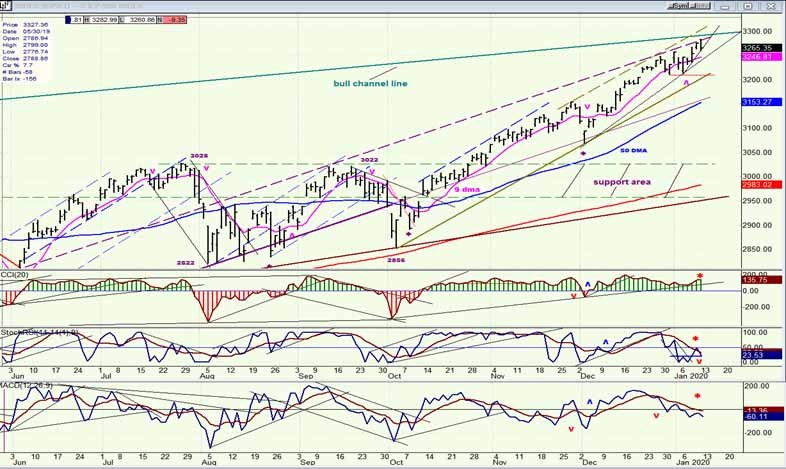
SPX daily chart
The new high in SPX was short-lived, as it met with resistance at the dashed trend line which has contained prices for the past two weeks. If it tries to move higher, the index will encounter even more serious resistance at the top of the bull market channel line; but it is apparently going to try for it since 3300 is likely to be the next P&F target.
After nine years of bullishness followed by a sharp correction, SPX was able to maintain another sustained uptrend to the top of its long-term channel. This is remarkable in itself, but won’t be the end of it. After a correction, the index should go for even higher targets over the next several months, perhaps eventuallyreaching about 4000 – another 700 points! But not before we imminently experience a correction which will pull it away from the top of the long-term channel and create some room for the next uptrend.
This is suggestedby cycles bottoming over the next few weeks, but it is also very apparent in the oscillators at the bottom of the chart, with the two lower ones (SRSI and A-Ds) already in the red and down-trending, and the laggard CCI just beginning to roll over after experiencing more negative divergence.
The final sequence should be as follows: first we should break the minor up-trend line, have a final rally(to 3300?), and then break the trend line from 3070. This should result in a decline that will continue into the three mid-February cycle lows.
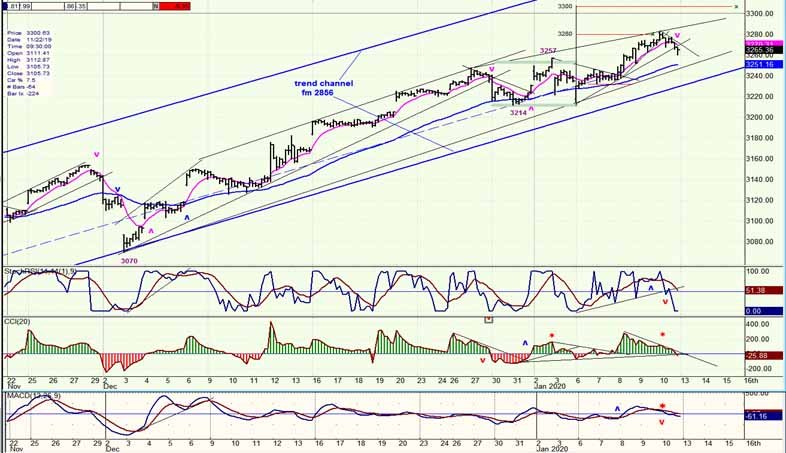
SPX hourly chart
The 3240 projection which was determined by the long-term P&F chart only stopped the uptrend from 2856 for a two-week consolidation which was followed by a price extension to 3281.82 before another minor correction took hold on Friday.
The congestion pattern established during that two-week pause gave us a new projection target to 3280-3300. 3280 was reached on Fridayand gave way to a 22-point pull-back. If Friday’s low is exceeded, correction targetsconsist of 3256 (.382), and perhaps farther down to 3248 (.50), before we embark on the last thrust to 3305.
Because Friday’s close brought the oscillators to the verge of a sell signal, Monday morning will have to open higher and show some sustained buying to avoid one. But since Friday’s retracement had not even reached 3256, it’s likely that our corrective move is not yet complete. When it is, either a retest of 3280 or a final high of 3305is likely.
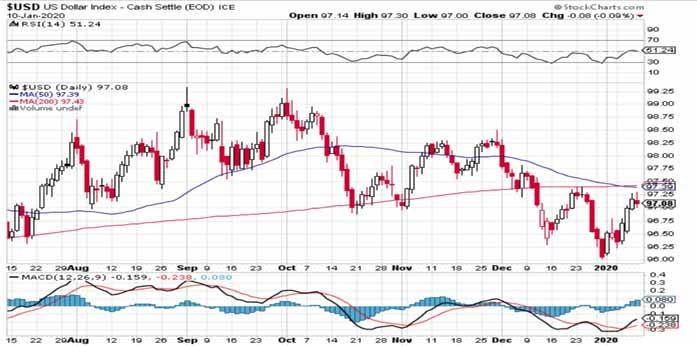
$USD daily (courtesy StockCharts)
The dollar has rebounded from nearly 96 to a little above 97. After a little pull-back, it may continue to move up into the resistance created by the junction of the 50-dma and the 200-dma. This resistance area could put any further progress on hold for some time; at least until mid-February.
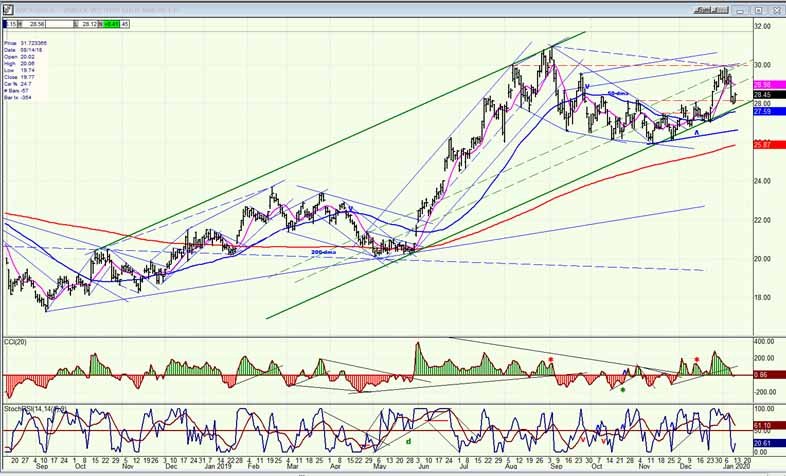
GDX (Gold miners ETF) weekly
After finding resistance just below the former high of 30.96, SPX is consolidating ahead of its next move to a new high which could take it to about 34.50 before another short-term correction. The length of the current consolidation is expected to be about two weeks.
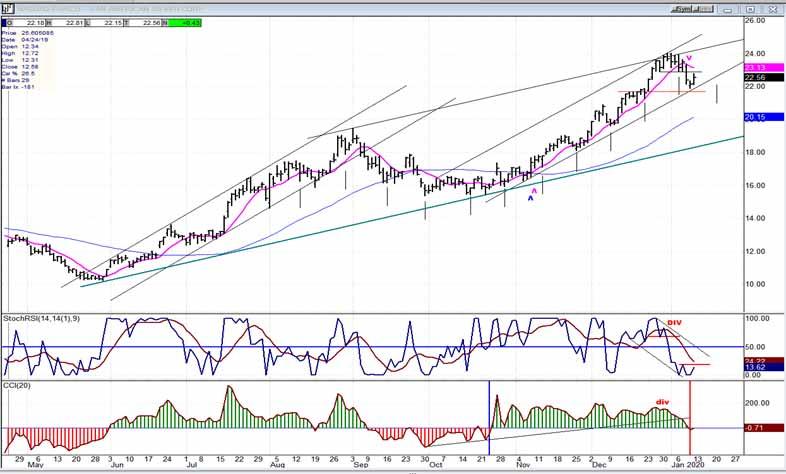
PASS (Pan American Silver Corp.) Weekly
PAAS is moving pretty much in tandem with GDX. Both are undergoing a short-term correction after which PAAS should rise to a new high estimated to be at least 29.00.
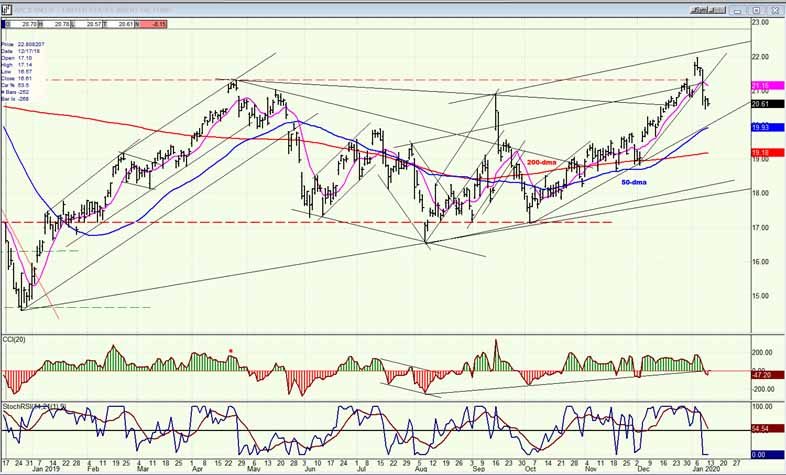
BNO (U.S. Brent oil fund) daily
BNO reached its short-term projection to 22.00 and is pulling-back. Not sure how long this correction is going to last. Index action will tell us.
Summary
A final thrust to about 3300 is possible when the trade deal is signed next Wednesday. I would expect this to be the final hurrah of the SPX before cycles take over and bring about a decline into mid-February. IWM is already giving us advance warning.
The comments made in the daily updates and the Market Summary about the financial markets are based purely on what I consider to be sound technical analysis principles. They represent my own opinion and are not meant to be construed as trading or investment advice, but are offered as an analytical point of view which might be of interest to those who follow stock market cycles and technical analysis.
Recommended Content
Editors’ Picks
EUR/USD fluctuates near 1.0700 after US data

EUR/USD stays in a consolidation phase at around 1.0700 in the American session on Wednesday. The data from the US showed a strong increase in Durable Goods Orders, supporting the USD and making it difficult for the pair to gain traction.
USD/JPY refreshes 34-year high, attacks 155.00 as intervention risks loom

USD/JPY is renewing a multi-decade high, closing in on 155.00. Traders turn cautious on heightened risks of Japan's FX intervention. Broad US Dollar rebound aids the upside in the major. US Durable Goods data are next on tap.
Gold keeps consolidating ahead of US first-tier figures

Gold finds it difficult to stage a rebound midweek following Monday's sharp decline but manages to hold above $2,300. The benchmark 10-year US Treasury bond yield stays in the green above 4.6% after US data, not allowing the pair to turn north.
Worldcoin looks set for comeback despite Nvidia’s 22% crash Premium

Worldcoin price is in a better position than last week's and shows signs of a potential comeback. This development occurs amid the sharp decline in the valuation of the popular GPU manufacturer Nvidia.
Three fundamentals for the week: US GDP, BoJ and the Fed's favorite inflation gauge stand out Premium

While it is hard to predict when geopolitical news erupts, the level of tension is lower – allowing for key data to have its say. This week's US figures are set to shape the Federal Reserve's decision next week – and the Bank of Japan may struggle to halt the Yen's deterioration.