Recommendation for Hang Seng Index: Buy
Buy Stop: Above 26369.8
Stop Loss: Below 25432.3
RSI: Neutral
MACD: Buy
Donchian Channel: Buy
MA(200): Sell
Fractals: Buy
Parabolic SAR: Buy
Chart analysis
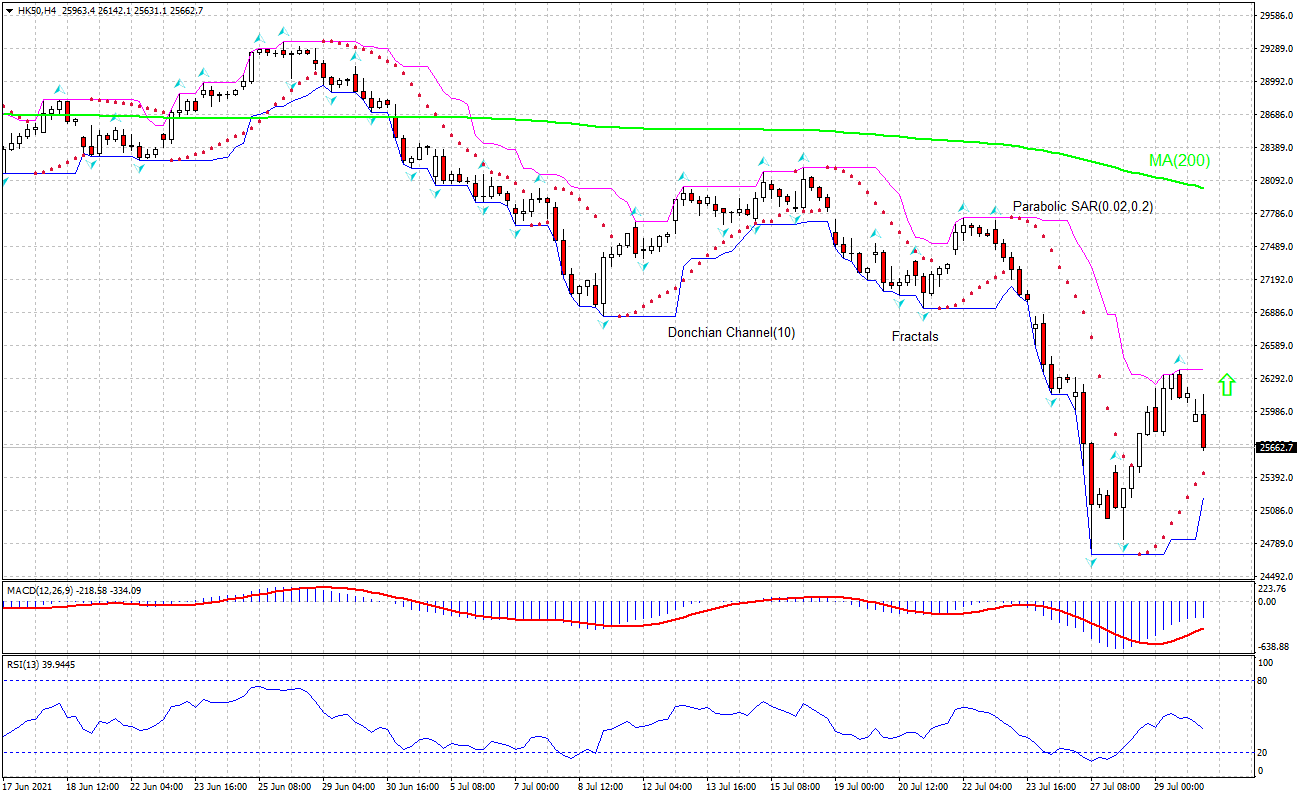
On the 4-hour timeframe the HK50, H4 has fallen below the 200-period moving average MA(200) which is falling still. We believe the bullish momentum will continue after the price breaches above the upper Donchian boundary at 26369.8. This level can be used as an entry point for placing a pending order to buy. The stop loss can be placed below the lower Donchian boundary at 25432.3. After placing the pending order the stop loss is to be moved every day to the next fractal low, following Parabolic indicator signals. Thus, we are changing the expected profit/loss ratio to the breakeven point. If the price meets the stop-loss level (25432.3) without reaching the order (26369.8) we recommend canceling the order: the market sustains internal changes which were not taken into account.
Fundamental analysis
HK 50 forecast is bullish despite recent mixed data. Will the HK50 rebound continue? Recent Hong Kong economic data were mixed. Business confidence rose more than expected in third quarter, and unemployment declined in June, however, consumer inflation declined when an increase was expected in June, and the balance of trade deficit rose in June. Thus, the business confidence indicator in Hong Kong rose to 6 in the third quarter of 2021 compared to 0 in the previous period, a level not seen since the third quarter of 2018. Hong Kong's seasonally adjusted unemployment rate fell to 5.5% in the April to June period of 2021 down from 6% in the previous period. At the same time, Hong Kong’s annual inflation rate eased to 0.7% in June from a four-month high of 1.0% in the previous month when an uptick to 1.1% was forecast. And the trade deficit in Hong Kong widened to HKD 40.5 billion in June from HKD 25.5 billion a year earlier when a decline to 14 billion was expected. The Hong Kong stock index retreated steeply in the current month, however, the retreat seems to have halted in the last couple of days.
Want to get more free analytics? Open Demo Account now to get daily news and analytical materials.
This overview has an informative character and is not financial advice or a recommendation. IFCMarkets. Corp. under any circumstances is not liable for any action taken by someone else after reading this article.
Recommended Content
Editors’ Picks
EUR/USD clings to daily gains above 1.0650

EUR/USD gained traction and turned positive on the day above 1.0650. The improvement seen in risk mood following the earlier flight to safety weighs on the US Dollar ahead of the weekend and helps the pair push higher.
GBP/USD recovers toward 1.2450 after UK Retail Sales data

GBP/USD reversed its direction and advanced to the 1.2450 area after touching a fresh multi-month low below 1.2400 in the Asian session. The positive shift seen in risk mood on easing fears over a deepening Iran-Israel conflict supports the pair.
Gold holds steady at around $2,380 following earlier spike

Gold stabilized near $2,380 after spiking above $2,400 with the immediate reaction to reports of Israel striking Iran. Meanwhile, the pullback seen in the US Treasury bond yields helps XAU/USD hold its ground.
Bitcoin Weekly Forecast: BTC post-halving rally could be partially priced in Premium

Bitcoin price shows no signs of directional bias while it holds above $60,000. The fourth BTC halving is partially priced in, according to Deutsche Bank’s research.
Week ahead – US GDP and BoJ decision on top of next week’s agenda

US GDP, core PCE and PMIs the next tests for the Dollar. Investors await BoJ for guidance about next rate hike. EU and UK PMIs, as well as Australian CPIs also on tap.