![]() Matt Simpson, CFTe, MSTA
Matt Simpson, CFTe, MSTA
CityIndex
The S&P E-mini closed the session with a bullish engulfing candle yesterday and has broken to an intraday high in Asia, on the back of positive news on the US-China trade negotiations. According to President Trump, China has indicated trade talks are advancing, which raises hopes that a trade deal could be signed in Chile next month.
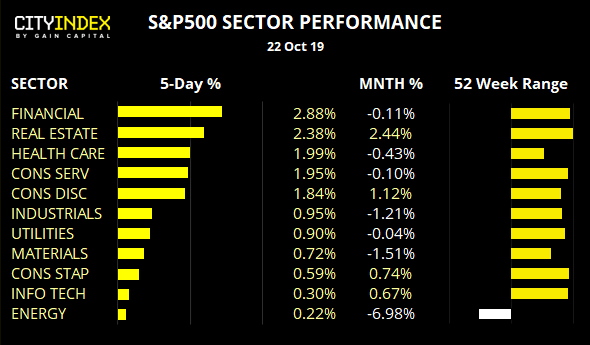
Still, the &P500 has reported YoY decline in earnings for a third quarter, which is currently -4.7%. Whilst revenues are higher at 2.6%, it points towards as squeeze on net profit margins for Q3. So it’s not all rosy at the highs.
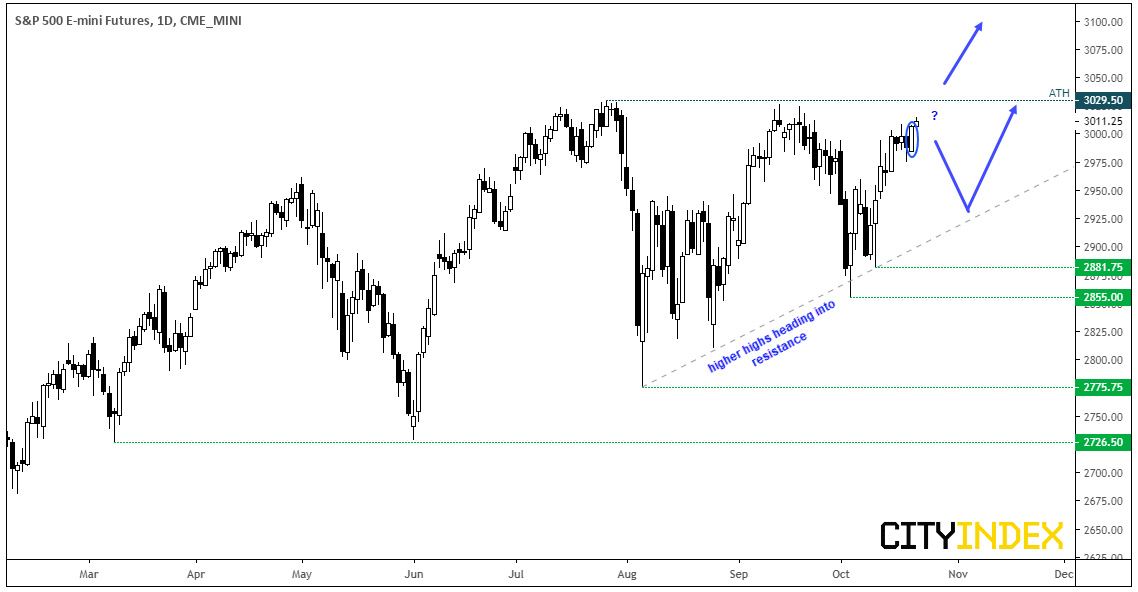
From a technical standpoint, it trades just 19 points from record highs which has bulls on high alert for a fresh breakout. Yet there’s also the potential for this to morph into an ascending triangle, which leaves room for at least another cycle lower (with a higher low or two) before breaking out.
- The reward to risk potential is unappealing for bulls, being so close to the all-time highs, Therefor, they may want to wait for a break above 3029.50 for even a daily close, before assuming a breakout is underway.
- Bears could also consider fading into any minor rally below key resistance. However, keep in mind this is counter to the long-term uptrend so likely carries greater risk.
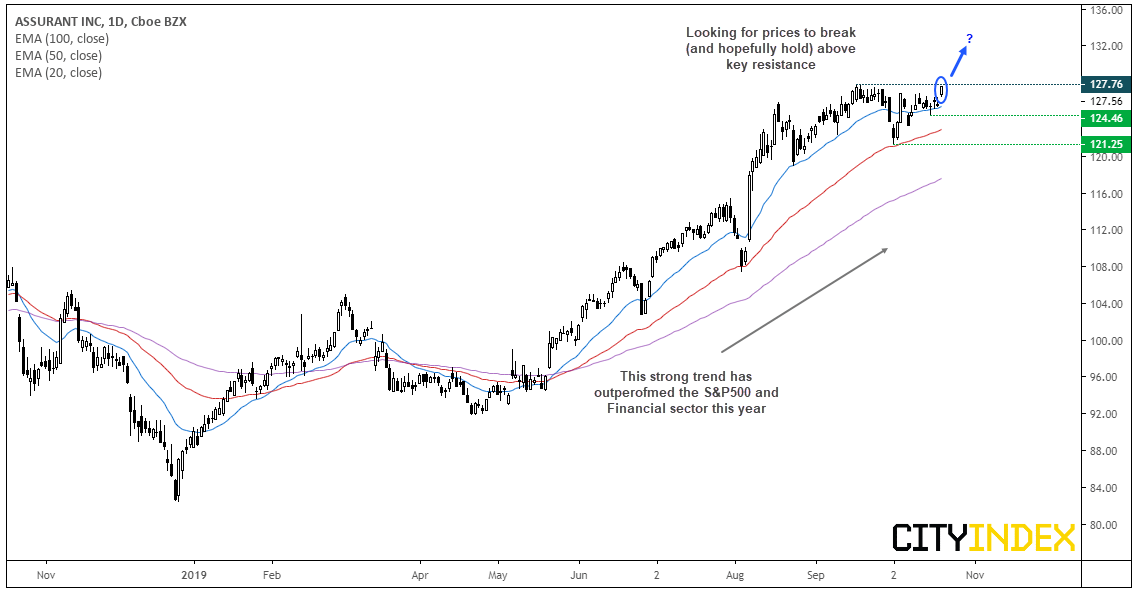
Assurant CFD/DFT: Currently around 25% up for the year, this household insurance company has outperformed both the S&P500 and financial sector. Structurally, the daily trend is clearly bullish and is on the cusp of breaking to a new 52-week high. The 50-day eMA provided support and marks the potential swing low, and yesterday’s gap higher saw it gap out of compression. Given we’ve just seen over a month of consolidation at the highs, there are no clear signs of overextension despite it sitting near its record highs.
- A clear break (and / or close) above 127.76 assumes bullish trend continuation.
- The trend remains bullish above 121.25, although we could also step aside if momentum reverses and breaks beneath the small doji around 124.46
- Being near record highs, traders could use an open target if trading the daily timeframe
- Intraday momentum traders could also monitor this for a break higher, whilst swing traders could wait to see if the 127.76 area holds as support
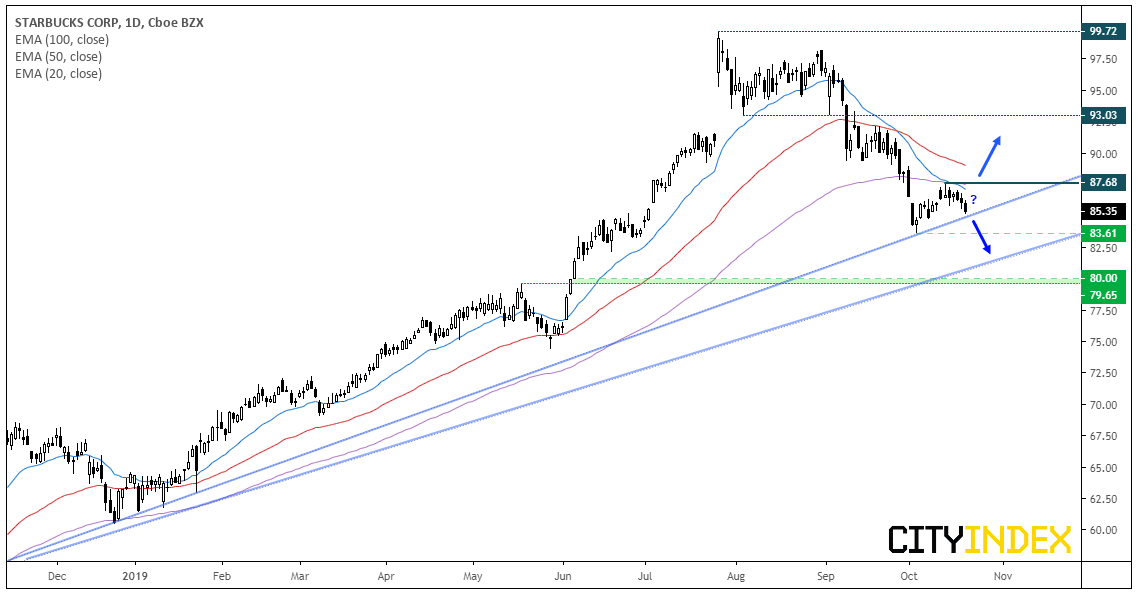
Starbuck Corp CFD/DFT: The price action on SBUX has caught our eye, as it’s at a technical juncture. From June ’18 to July this year, it traded in a very strong, almost parabolic bullish trend. Yet since peaking just below 100, a counter-trend move has unfolded with a series of lower lows and highs and its recent pullback has found resistance at the 100 and 20-day eMA’s. Furthermore, the 20-day eMA has crossed blow the 100 and the 50-day also points lower. Whilst this would be an appealing setup to bearish swing traders, prices have stalled at the September ’18 trendline.
- A break of the Sep ’18 trendline confirms a resumption of the bearish trend from the 2018 high and target the 83.61 low initially, and the June ’18 trendline and the high around 80.
- Bulls could wait to see if the bullish trendline holds and momentum breaks above the 87.68 high. This would also break back above the 20 and 100-eMA’s and create a higher low and higher high.
Apple Inc CFD/DFT: After finding support at the prior ATH’s around 233, its closed to fresh new highs and keeps the bullish channels very much alive and well. With no clear signs of a top, the trend points high and could be an equity for intraday momentum traders to also consider.
Applied Materials CFD/DFT: The Cup and handle pattern could still be in play although, ideally, we should have seen a direct breakout. Instead, Thursday’s bearish hammer closed back just below the original breakout level to warn of a hesitancy to break higher, although the overall structure remains bullish. Support has been found at the 20-day eMA, so a break below 51.00 warns of a deeper correction against the dominant trend (and perhaps towards the December trendline). Whereas a break above 53.25 assumes bullish continuation.
Cisco Systems CFD/DFT: A downside break remains the bias as part of a head and shoulders top, whilst prices remain beneath the 48.13 high. Whilst prices have made a half-hearted attempt to move higher, momentum lacks conviction. Ultimately, it remains in the watchlist for a larger downside move but we’re not on high alert of a sell signal just yet.
Related analysis:
- S&P500: The Long And Short Of It | Cisco, Welltower, Applied Material
- FTSE Pauses At Resistance | CWK, CTEC, IMB
CFD and forex trading are leveraged products and can result in losses that exceed your deposits. They may not be suitable for everyone. Ensure you fully understand the risks. From time to time, City Index Limited’s (“we”, “our”) website may contain links to other sites and/or resources provided by third parties. These links and/or resources are provided for your information only and we have no control over the contents of those materials, and in no way endorse their content. Any analysis, opinion, commentary or research-based material on our website is for information and educational purposes only and is not, in any circumstances, intended to be an offer, recommendation or solicitation to buy or sell. You should always seek independent advice as to your suitability to speculate in any related markets and your ability to assume the associated risks, if you are at all unsure. No representation or warranty is made, express or implied, that the materials on our website are complete or accurate. We are not under any obligation to update any such material. As such, we (and/or our associated companies) will not be responsible or liable for any loss or damage incurred by you or any third party arising out of, or in connection with, any use of the information on our website (other than with regards to any duty or liability that we are unable to limit or exclude by law or under the applicable regulatory system) and any such liability is hereby expressly disclaimed
Recommended Content
Editors’ Picks
How will US Dollar react to Q1 GDP data? – LIVE

The US' GDP is forecast to grow at an annual rate of 2.5% in the first quarter of the year. The US Dollar struggles to find demand as investors stay on the sidelines, while waiting to assess the impact of the US economic performance on the Fed rate outlook.
EUR/USD holds gains above 1.0700, as key US data loom

EUR/USD holds gains above 1.0700 in the European session on Thursday. Renewed US Dollar weakness offsets the risk-off market environment, supporting the pair ahead of the key US GDP and PCE inflation data.
GBP/USD extends recovery above 1.2500, awaits US GDP data

GBP/USD is catching a fresh bid wave, rising above 1.2500 in European trading on Thursday. The US Dollar resumes its corrective downside, as traders resort to repositioning ahead of the high-impact US advance GDP data for the first quarter.
Gold price edges higher amid weaker USD and softer risk tone, focus remains on US GDP

Gold price (XAU/USD) attracts some dip-buying in the vicinity of the $2,300 mark on Thursday and for now, seems to have snapped a three-day losing streak, though the upside potential seems limited.
XRP extends its decline, crypto experts comment on Ripple stablecoin and benefits for XRP Ledger

Ripple extends decline to $0.52 on Thursday, wipes out weekly gains. Crypto expert asks Ripple CTO how the stablecoin will benefit the XRP Ledger and native token XRP.