![]() TradingDaze
TradingDaze
Aisys Technologies Inc.
The next 1/2 year Forecast Dates are available for purchase.
(July, 1 2017 – December 31, 2017)
Subscribers receive 6 months forecast no matter when they sign up.
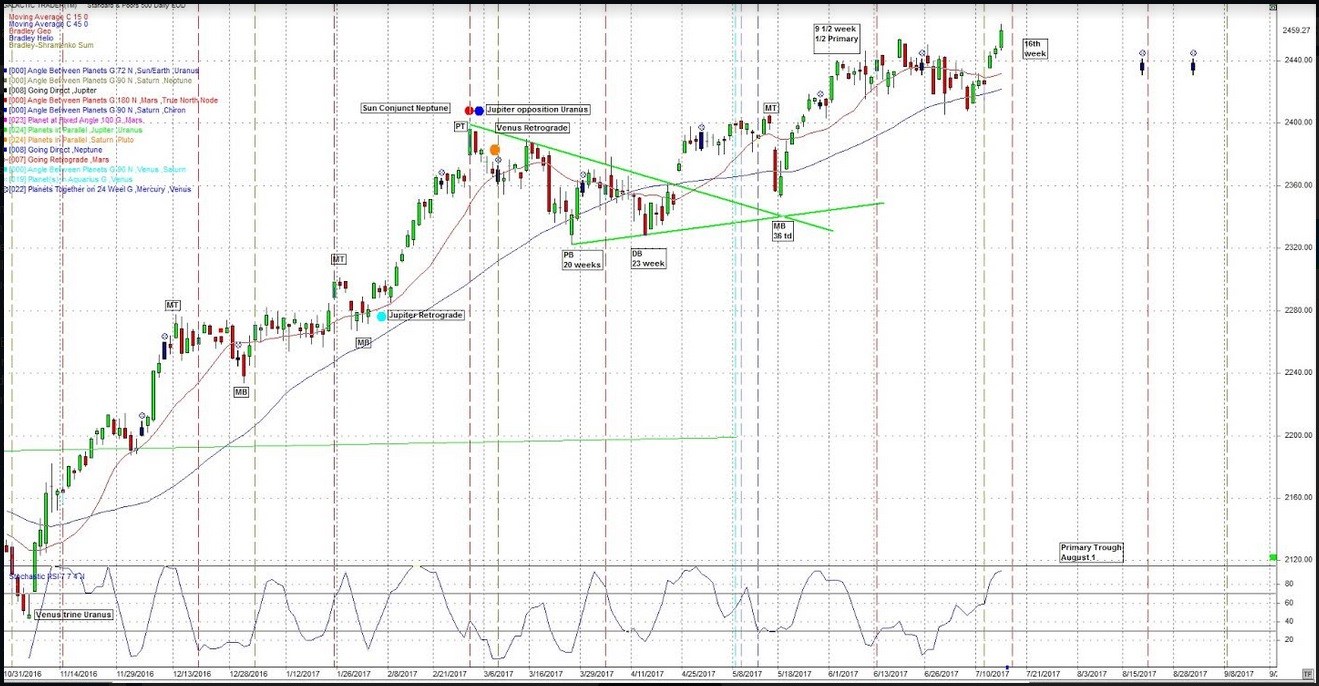
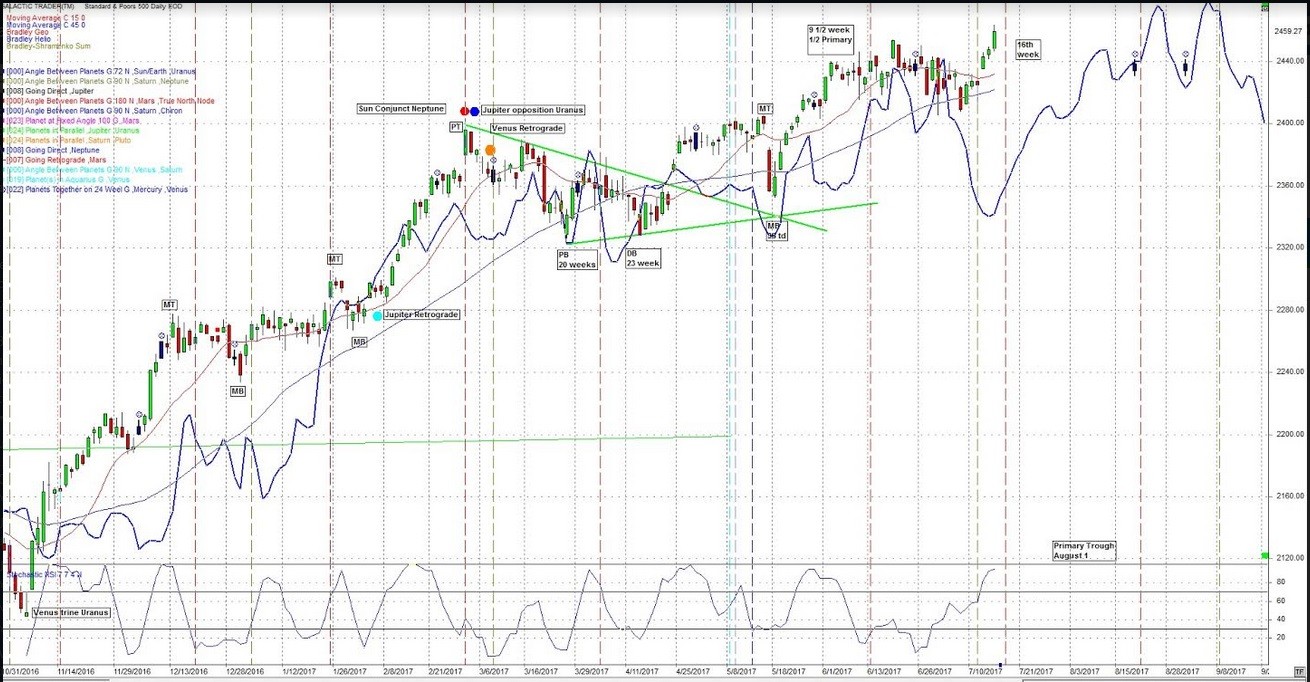
SP500
For the SP500, cycle-wise I’m looking at March 27th as the Primary cycle trough and April 13th as a double bottom.
This puts us entering the 16th week of the Primary cycle. Instead of a nominal 6 week cycle I’m looking at the other possibility which would be a ½ Primary cycle (9 ½ week) cycle high. We are in the time frame for the nominal 18 week cycle trough. The exact 18 week would trough out during the first week in August. The range; however, is 15 – 22 weeks.
It should be mentioned there is a remote possibility we put in an early Primary cycle trough on July 6th. Price went below the 15 and 45 day sma’s. This was not very deep and early being in the 15th week. This possibility should be watched closely although I think it is too early. Looking at the major US indices both the DJIA and SP500 made new all time highs on July 14th with the Nas very close.
Price has moved above both the 15 and 45 sma which is what to expect when the SP500 moves higher. This needs to be watched next week.
Next week has the first forecast date for the 2nd half of 2017, July 17th +- 5 td’s (trading days). This should mark a change in trend. If stocks go down it would negate the possible Primary cycle trough on July 6th.
The next two weeks will see a number of Mars aspects. We can expect conflict, social unrest, terrorists and political upset and volatility in the markets. The latter could be sudden events dealing with the legislature or parliament. Subscribers have the full list.
For example, the Sun conjunct Mars could stand for issues involving the party out of power, the land and homes of the common people. Weather and agriculture may also be affected. Mars should be more active the week of July 17 then 24th. In particular July 17 and July 18th are possibly violent. Venus signature are also apparent. Venus standing for money but in this case oil and gas.
Uranus will be semi square Neptune from mid-July through October. This will be a longer period delusion/deception. It may be more like a fog that has descended that is confusing. For the markets people won’t know what the direction will be. A more precise description will be made available once we go through the changes associated with the Astrological aspect in late July and mid-August.
The following chart shows the 40 week cycle on the Dow Jones chart. At it’s current rate it will be in it’s trough area close to the trough for the Primary cycle which is the 1st week in August. The vertical blue lines are the 40 week cycle.
Another cycle that is coming up is the 50 week cycle. These are shown as the pink vertical lines. The next one is by date is July 24th but I would say July or August. As I would expect a 10-12% decline this time may be unusual in that the markets have been distorted by Central Bank money.
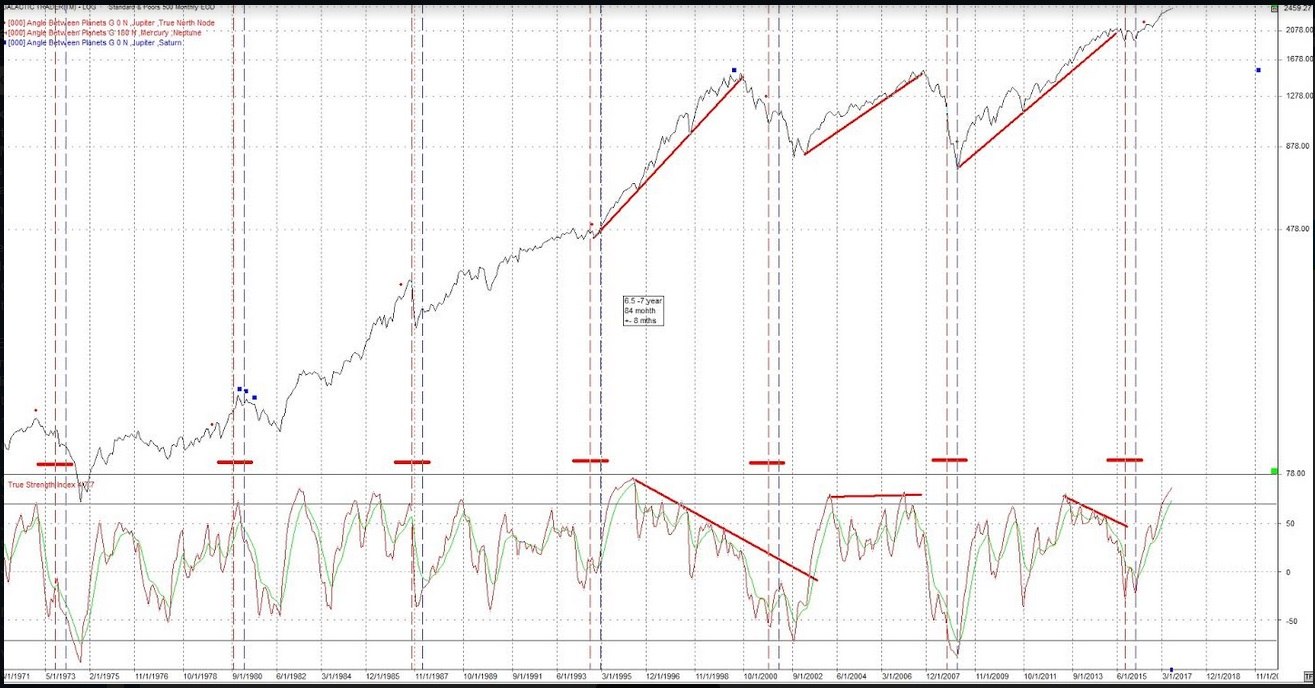
I had shown the 7 years chart some time ago. Following is that chart. The vertical lines are the 84 months (7 year). The short red lines are the potential orb of influence. You can see the current 7 year is very overdue.
We still have:
-
the 45 year Saturn/Uranus trine Next due November 11
-
The 12 year Jupiter/Pluto Square Next due August 4th
-
The 14 year Jupiter/Uranus opposition Next due Sept. 28
These longer-term aspects need a broad orb and should be +- a few weeks at least. They have been described in the subscriber report. Note the Jupiter/Pluto square is often seen close to Primary cycle troughs.
In addition to the above there is a potent transit between transiting Saturn square the USA natal Neptune.
Hard aspects to the USA's Neptune and Mars often coincide with financial disruption. Saturn will square the USA Neptune and oppose it's natal Mars 3 times in 2017. January, July and October.
The effect of Saturn square Neptune is deflationary. With the buildup of credit in the economy the above aspects could bring on defaults, cash shortages putting stress on the credit markets. Any signs of deflation or defaults should cause the central banks to print. Inflation is quite possible after that.
Following is a chart of the SP500 and the Heliocentric Bradley indicator. The blue horizontal line. Watch for turns in price as the Bradley makes turns. It has no direction. It just tries to identify changes in trend and we may see a turn on Monday or Tuesday.
I continue to watch the 24th harmonic cycle (360/24) cycles for short term turns. The brown squares are Sun/Saturn 24 degrees on the following daily chart. The blue vertical lines are 24 cd’s (calendar days).
June 29th and July14th were a big range days.
The next hits are July 28th then Aug 11th.
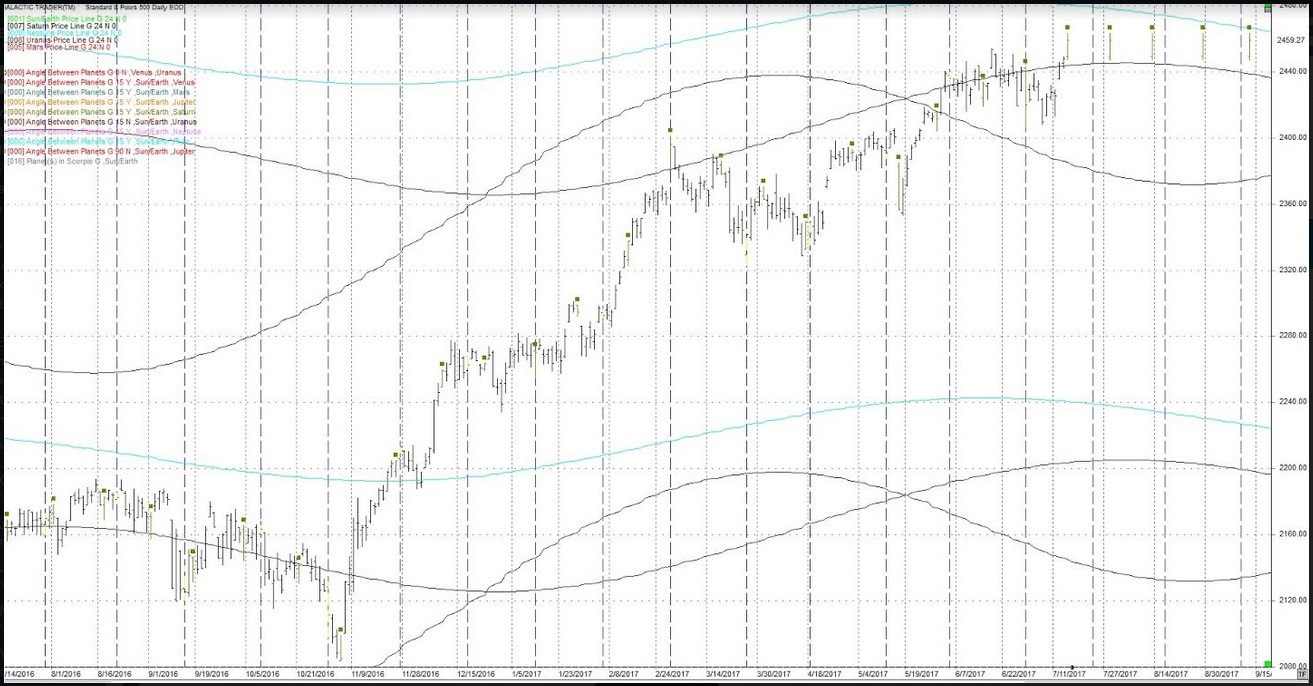
I have added 3 price lines to this chart.
-
Saturn - black
-
Uranus - purple
-
Neptune - light blue
These price lines can act as support / resistance. It has been at highs and lows. Note also when they cross often gets a reaction in price on a short term basis.
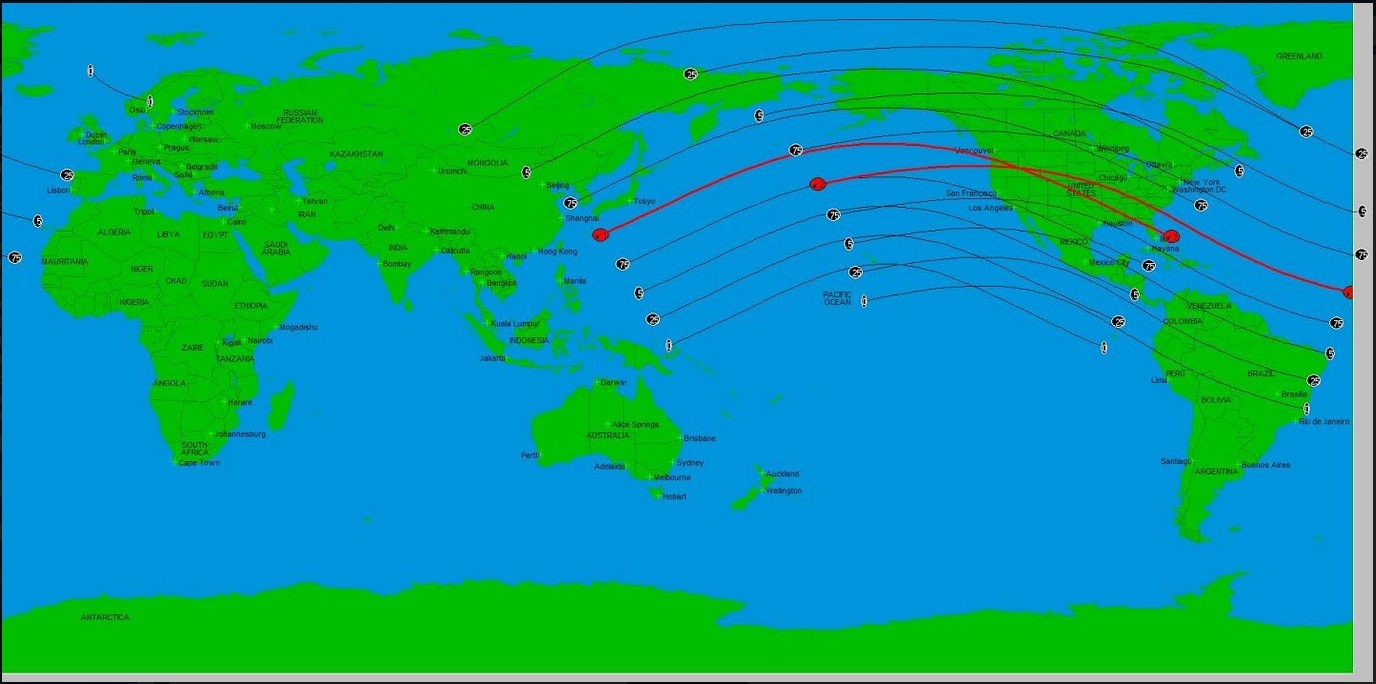
I brought up the August 21 Solar Eclipse in the May market letter. This should bring significant events in that time frame. In the mean time, I will monitor transits that may hit the location of the Solar Eclipse. An example is May 15th when the North Node transits over the point of the eclipse.
The path of this very important Eclipse is seen in the following:

For Total Solar Eclipses look for surprising and important events. I’m going to mention other eclipses that crossed the USA. I’ll leave the discussion of Saros and Metonic cycles for the subscriber’s report. This eclipse has Uranus trining the eclipse. This could stand for scientific or technological breakthroughs. It could also be a military or terrorist event
This eclipse should also affect President Trump as the eclipse is within 2 degrees of natal Mars in Trump’s birth horoscope. It is also almost on his ascendant. This could be a sudden breakthrough or surprising event.
Although a Total eclipse can affect any places on the planet it is usually strongest in the central eclipse path (see red lines on these charts)
The following 2 chart shows the last and the next Total Solar eclipses that cross the USA. The dates are June 8, 1918 and April 8, 2024. The June 8th date is close to the Spanish Flu breakout.
Includes June 8, 1918
And Including the April 8, 2024 eclipse.
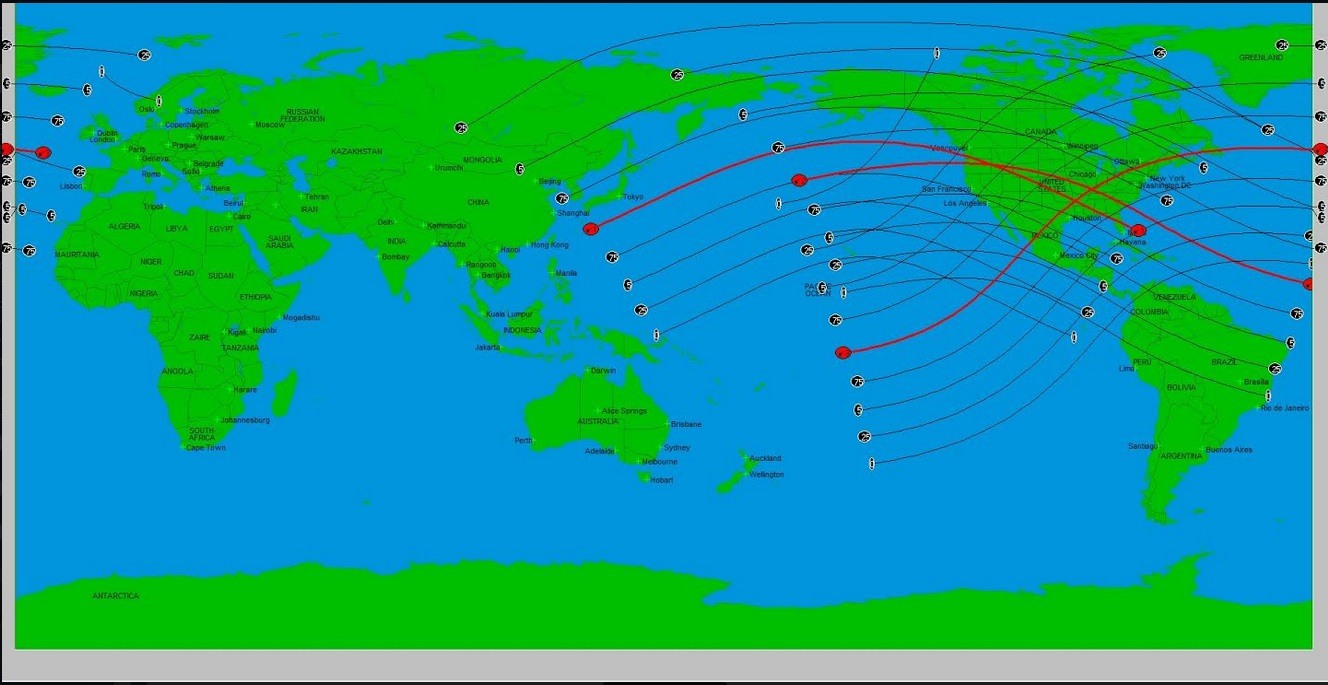
Where the eclipses cross can be a reactivation of an older eclipse. Note the two crossings in the north western states. This is approximately the location of Mount St. Helens.
I’ll come back to Iran in a future post. I’m expecting more problems involving Iran over the summer months. It could be around the eclipse window.
This blog will cover the stock market from a timing perspective. As such there will be no coverage of fundamental analysis. The approach will be to look for market cycles which are timed with Astrological cycles. When found technical analysis will be used to fine tune entries and exits. Most articles will include examples. For those who are dubious because it "just should not work", read a few posts. You may be very surprised. I am a certified accountant, computer programmer and astrologer. NORMAL STUFF The projections and information provided does not constitute trading advice, nor an invitation to buy or sell securities. The material represents the personal views of the author. Anyone reading this blog should understand and accept they are acting at their own risk. Each person should seek professional advice in view of their own personal finances.
Recommended Content
Editors’ Picks
AUD/USD holds hot Australian CPI-led gains above 0.6500

AUD/USD consolidates hot Australian CPI data-led strong gains above 0.6500 in early Europe on Wednesday. The Australian CPI rose 1% in QoQ in Q1 against the 0.8% forecast, providing extra legs to the Australian Dollar upside.
USD/JPY sticks to 34-year high near 154.90 as intervention risks loom

USD/JPY is sitting at a multi-decade high of 154.88 reached on Tuesday. Traders refrain from placing fresh bets on the pair as Japan's FX intervention risks loom. Broad US Dollar weakness also caps the upside in the major. US Durable Goods data are next on tap.
Gold price struggles to lure buyers amid positive risk tone, reduced Fed rate cut bets

Gold price lacks follow-through buying and is influenced by a combination of diverging forces. Easing geopolitical tensions continue to undermine demand for the safe-haven precious metal. Tuesday’s dismal US PMIs weigh on the USD and lend support ahead of the key US macro data.
Crypto community reacts as BRICS considers launching stablecoin for international trade settlement

BRICS is intensifying efforts to reduce its reliance on the US dollar after plans for its stablecoin effort surfaced online on Tuesday. Most people expect the stablecoin to be backed by gold, considering BRICS nations have been accumulating large holdings of the commodity.
US versus the Eurozone: Inflation divergence causes monetary desynchronization

Historically there is a very close correlation between changes in US Treasury yields and German Bund yields. This is relevant at the current juncture, considering that the recent hawkish twist in the tone of the Fed might continue to push US long-term interest rates higher and put upward pressure on bond yields in the Eurozone.