![]() Richard Perry
Richard Perry
Independent Analyst
Market Overview
Risk appetite remains positive in the wake of the French election. The momentum in the bull run is still there but it will be interesting to see if it can continue as attention turns to the BoJ, ECB, European inflation and US growth which all come towards the end of the week. However, for now the prospect of Donald Trump announcing his tax plan including his cut to the corporate tax rate to 15% (from 35%) and repatriation of overseas earnings has acted as rocket fuel to Wall Street. This means that safe haven trades are creaking under the pressure, with the yen and gold weaker, whilst Treasury yields also continue to recover. Positive US housing data (on New Home Sales and house prices) has also boosted sentiment. However with the strength of the euro in recent days, the trade weighted dollar is under pressure and is once again back below 99.0 and is now set to test its long term two year uptrend. But with the sharp rise in Treasury yields it may just be a matter of time before the dollar begins to find support once more. In a reflection of how positive equity traders are, the VIX went below 11 yesterday and was at its lowest level since 1st February.

Wall Street posted strong gains, with the S&P 500 +0.6%. Markets were also positive in Asia with the Nikkei +1.1% however, as with yesterday, we see European markets a touch more cautious, trading marginally lower. In forex majors the euro remains firm and is mildly outperforming again, whilst the yen continues to suffer. A drop in inflation data out of Australia to 1.9% on a trimmed mean basis (+1.8% expected) which was down from the +2.0% posted last month has hit the Aussie today (Aussie CPI was lower than expected), with the Kiwi also weaker. Gold has stabilized following yesterday’s sell-off but oil is struggling to maintain the traction of yesterday’s bounce.
Traders will have a another quiet day on the data front. Canadian Retail Sales at 1330BST is expected to fall by -0.3% for the month (ex-autos) which could have an impact on the Canadian Loonie this afternoon. Other than that the EIA oil inventories at 1530BST will drive volatility in the oil price with crude stocks expected to show an inventory drawdown of -1.2m barrels, whilst distillates are expected to drawdown by 1.2m barrels and gasoline is expected to drawdown by 0.8m barrels. The gasoline component will be watched after an unexpected inventory build last week which pulled oil lower.
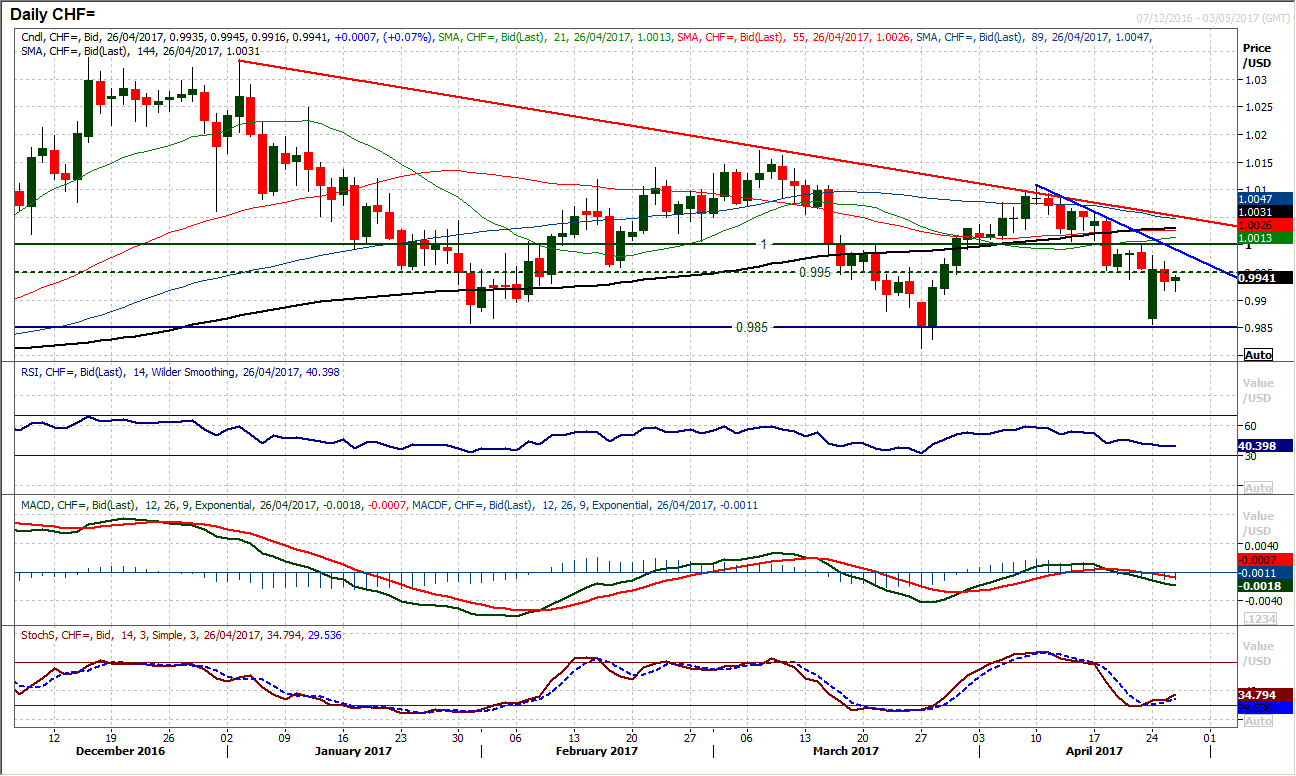
Chart of the Day – USD/CHF
The outlook has been under pressure since the late March/early April rally once more failed at the now four month downtrend, whilst the Swissy continues to put pressure on a long term pivot support around 0.9850. The January, March and now April lows were all posted around 0.9850 and once more looks set to be tested. Monday’s incredible recovery candle has simply been seen as another chance to sell as the market has failed once more in the 50 pip pivot band between 0.9950/1.0000. This comes with momentum indicators negatively configured to use near term rallies as a chance to sell. The RSI is back below 40 and historically tends towards the low 30s during the selling phases, whilst the MACD lines have just ruined lower and the Stochastics are struggling in bear territory. A test of 0.9850 seems likely now and with a sharper two week downtrend pulling the market lower, any rebound into 0.9950/1.0000 will continue to be a selling opportunity. Today’s early decline is adding to the corrective outlook whilst the hourly chart shows 0.9940 is initial resistance and yesterday’s high at 0.9970 is also a barrier.
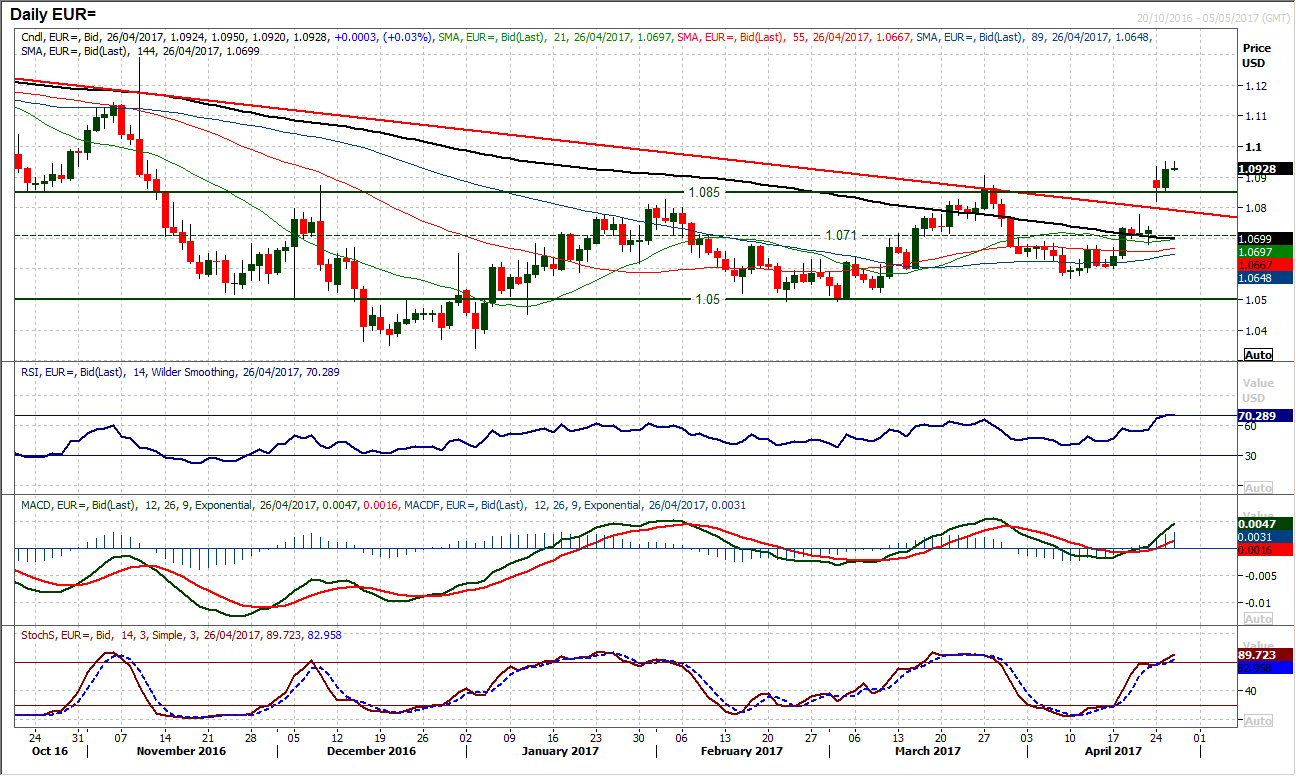
The breakout on the euro remains intact as yesterday’s strong bull candle continued the upside traction of this week. The market used the $1.0850 long term pivot as support to the pip for yesterday’s session low before pushing higher. The market has gained ground above Monday’s spike high which is also a key indication that the bulls are happy with the new outlook for the euro. Momentum is strong with the RSI now above 70 and the highest since February 2016. EUR/USD historically struggles with the RSI above 70 and this could begin to weigh on the breakout, so this is a run that should have stop losses closely tracked. For now though long positions are healthy and testing the resistance at $1.0950. A move above $1.0950 opens a run towards $1.1000 psychological and then the old pivot resistance around $1.1050/$1.1100. Given the level of the RSI, the prospect of a pullback towards $1.0800/$1.0850 is high though but this would be an are to look for renewed longs again.
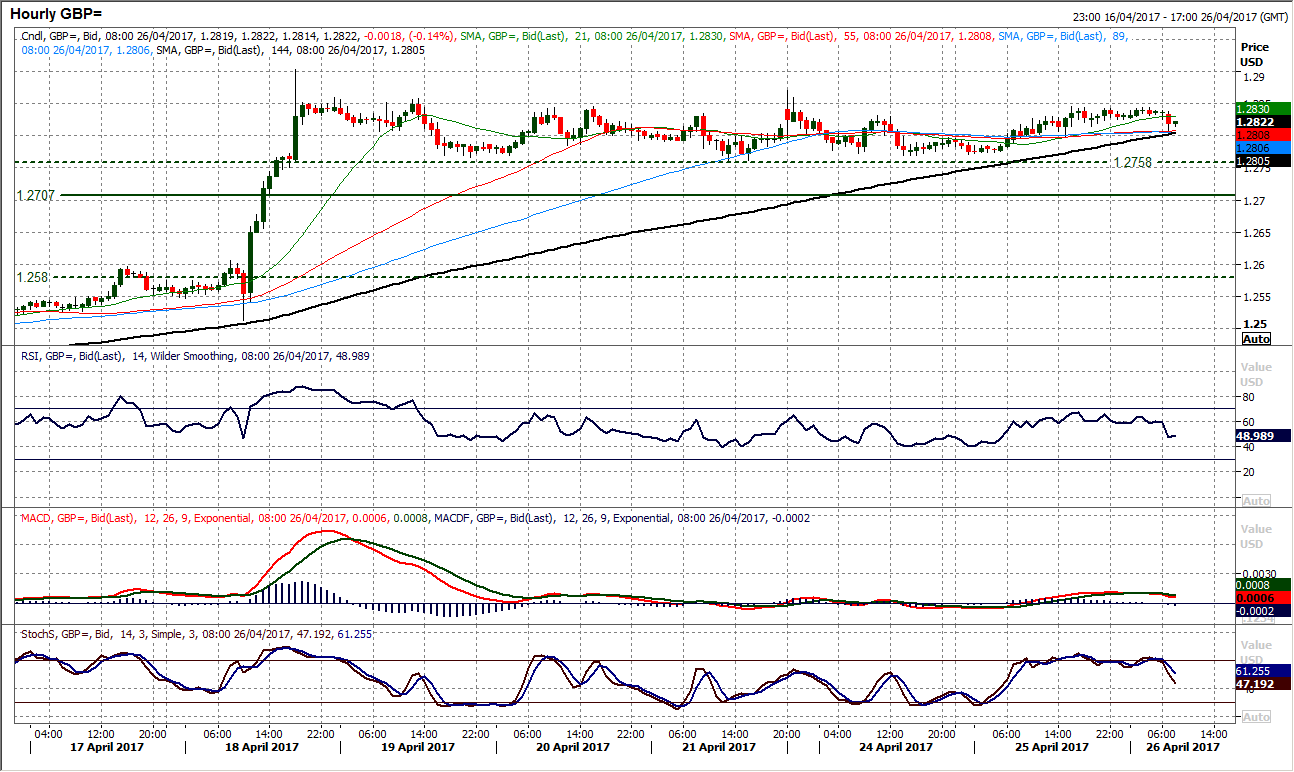
Whilst the euro may be running higher, Cable continues to consolidate. The past week has been a period of settled trading and little direction as a series of neutralising candles have been posted. Following Monday’s bear candle, we have now had an almost equal and opposite bull candle that has neutralised the outlook once more. The support continue to form around the support of the old $1.2775 high. The momentum indicators remain in positive configuration but have also been plateauing. The hourly chart shows a range trade with the hourly RSI oscillating between 30/70. Support is at the $1.2760 low but the rallies are unable to breach $1.2870, with the key spike high at $1.2905. The outlook remains positive following the medium to longer term breakout but the move just needs a catalyst now.
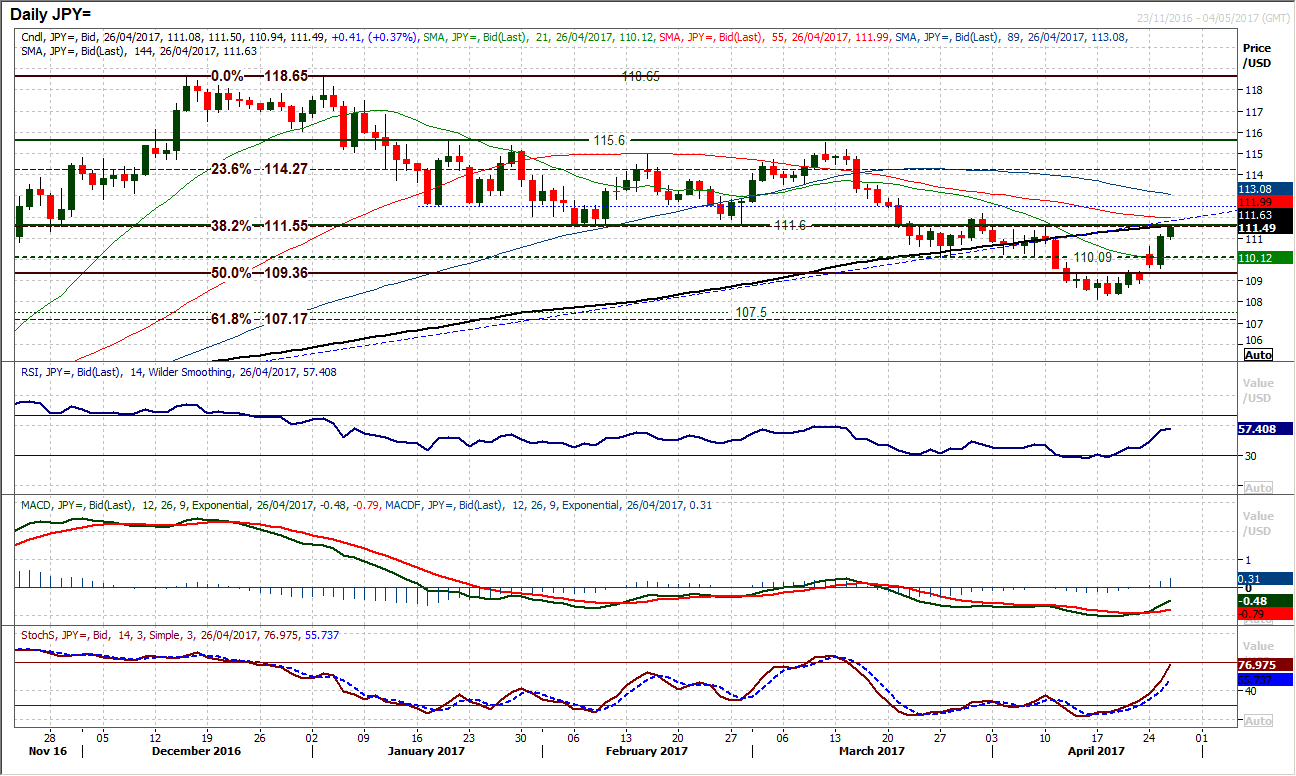
USD/JPY
The weakening yen is continuing to pull Dollar/Yen higher. The momentum in the recovery continues to form and yesterday’s strong bull candle has now put the market in line for a test of the key overhead supply at 111.60. This is the old key floor throughout February which has now become resistance again in April. It is also around the 38.2% Fibonacci retracement of 100.07/118.65 at 111.55. Furthermore, it is currently also the underside of the old uptrend since September. A decisive break back above this confluence of resistances would be a key move for the bulls. The momentum continues to improve with the Stochastics accelerating higher. With today’s positive open the market is really eying a test of this resistance now. Above 111.60 opens 112.20 and above there would be confirmation that the bulls were back in control. The hourly chart reflects the continued strength of momentum. Initial support is 110.95 and then the band at 110.10/110.60.
Gold
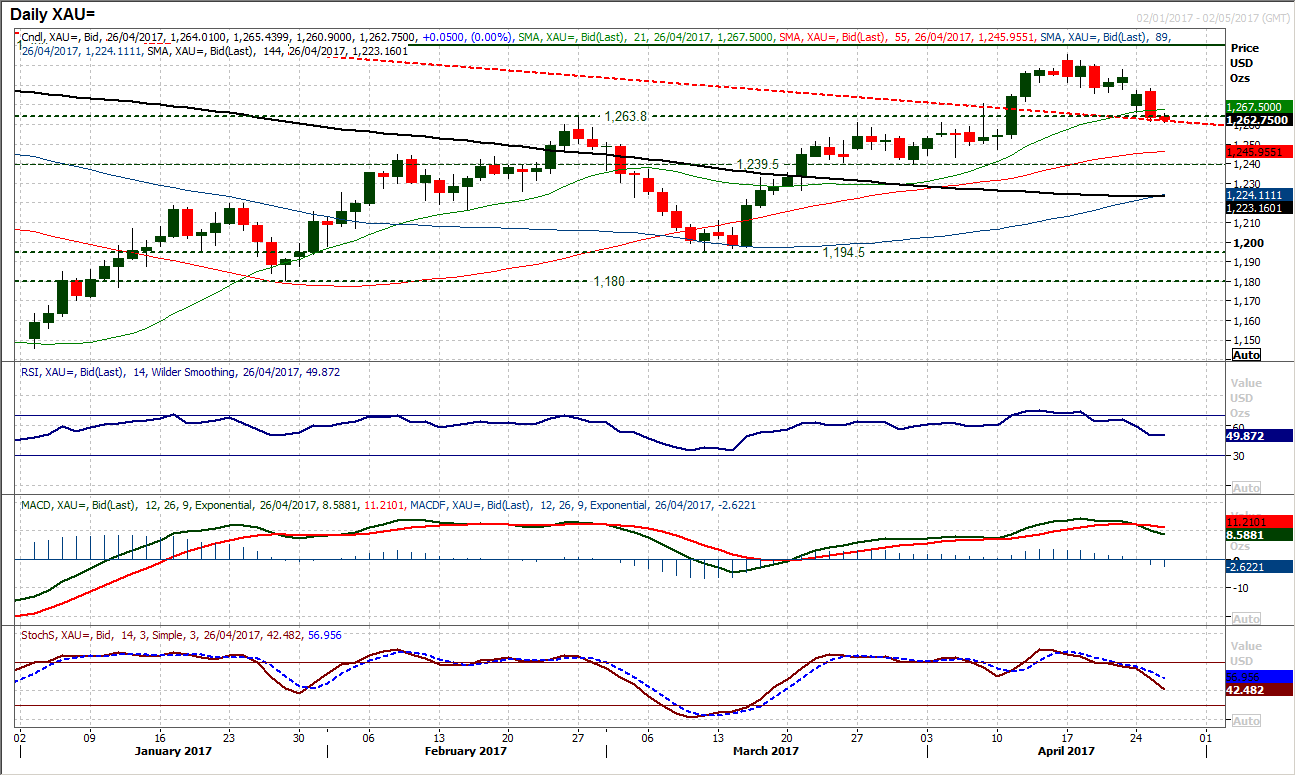
The correction on gold is gathering pace now. Yesterday’s strong bear candle was a significant move which was not only a bearish outside day but also really began to pull the momentum indicators into a corrective configuration. The key near term support at $1261 is now under pressure and a closing breach would open for further correction back towards $1240 again. This move increasingly has the hallmarks of similar corrective moves of January and more specifically March, where the latter saw a correction of around $70 in just over two weeks. However on both occasions the bulls regained control for a strong run higher over subsequent weeks. The hourly chart shows that gold has already tested the $1261 support today and it remains under pressure. A corrective configuration has certainly taken hold on momentum and rallies are now a chance to sell. Initial resistance is at $1265/$1270 today, with yesterday’s high at $1278 now key. Support below $1261 comes in at $1253 and $1247.
WTI Oil
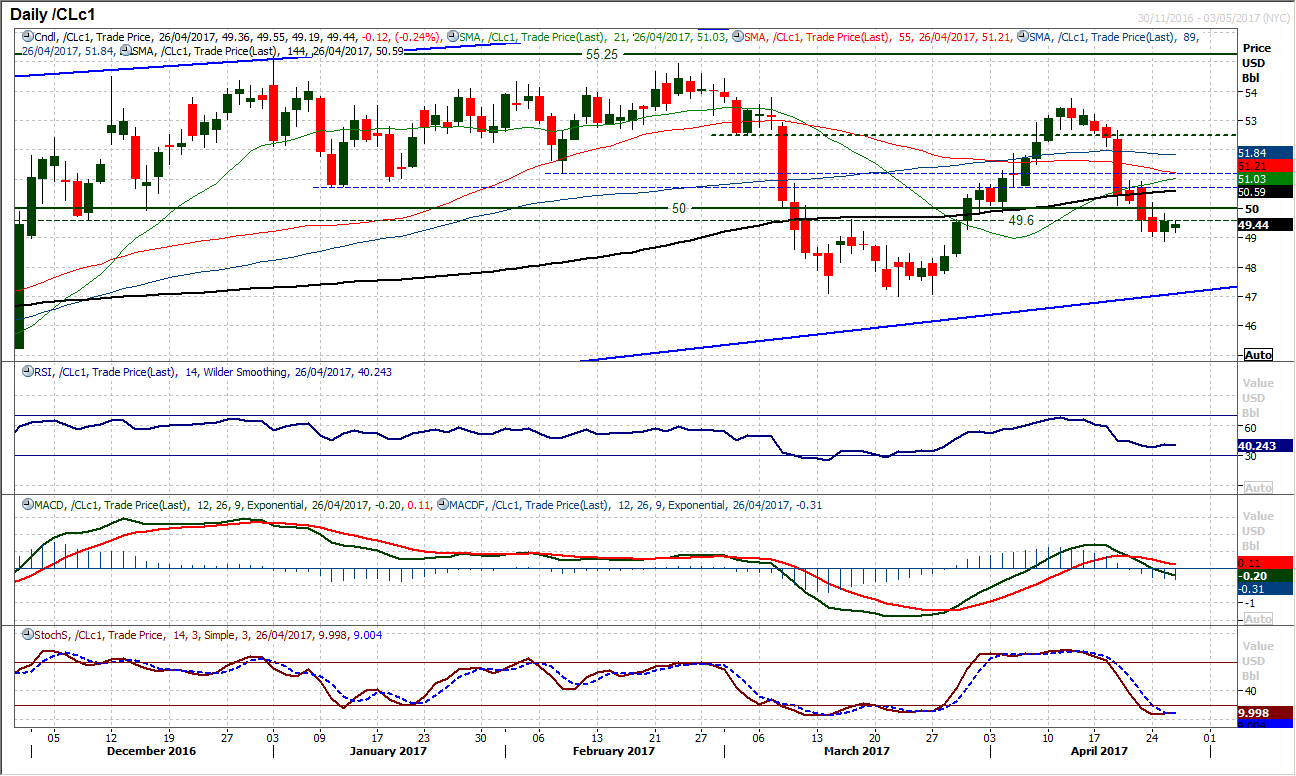
Finally a bit of support for oil. Instead of selling off into the close, the oil bulls finally managed to make some headway in the session and posted a rebound. However, the initial resistance of $49.60 to $50.00 is now overhead supply and will need to be broken to prevent this from becoming a consolidation that just gets sold into again. The market closed around the resistance at $49.60 which is a pivot which could be concerning if this remains in place again today. It would strengthen the resistance band $49.60/$50.00, with the market beginning to consistently trade below key overhead supply now. There have also now been eight consecutive sessions of lower highs, with yesterday’s peak at $49.83 adding to resistance. Momentum remains corrective with the RSI around 40, the MACD lines in decline and the Stochastics in negative configuration. Yesterday’s low at $48.87 is initial support and beyond there is $48.50, with the key lows at $47.00 an increasing possibility. The bulls need to close above resistance at $50.00 to suggest an improvement now. Watch out for the volatility from the EIA inventories.
Dow Jones Industrial Average
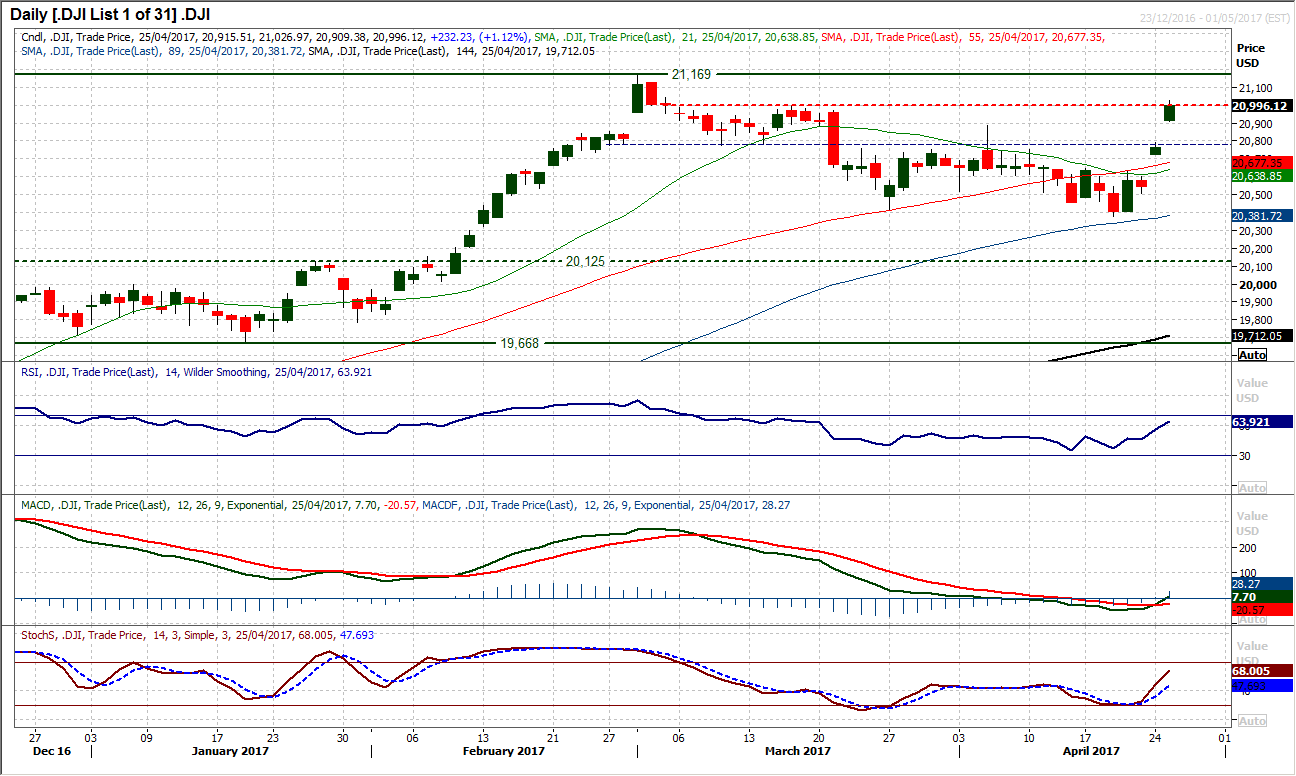
The positive risk appetite continues to grow on Wall Street after a second consecutive jump of more than a percent. The move in the past couple of days has completely blown the corrective move out of the water. A close back above the reaction high at 20,887 has been confirmed on the momentum indicators, with the RSI at a five week high, a bull cross on the MACD lines and the Stochastics advancing strongly. There are now two huge opening gaps higher in the past couple of sessions which reflect the increased positivity. Corrections into support are suddenly ready to be seen as a chance to buy, with the old pivot resistance around 20,775. Resistance is under increasing pressure with 21,000 under scrutiny yesterday, breached intraday but just failing into the close. A closing upside break would re-open the all time high at 20,169. Support is initially with yesterday’s low at 20,909 with 20,792 the gap support.
Note: All information on this page is subject to change. The use of this website constitutes acceptance of our user agreement. Please read our privacy policy and legal disclaimer. Opinions expressed at FXstreet.com are those of the individual authors and do not necessarily represent the opinion of FXstreet.com or its management. Risk Disclosure: Trading foreign exchange on margin carries a high level of risk, and may not be suitable for all investors. The high degree of leverage can work against you as well as for you. Before deciding to invest in foreign exchange you should carefully consider your investment objectives, level of experience, and risk appetite. The possibility exists that you could sustain a loss of some or all of your initial investment and therefore you should not invest money that you cannot afford to lose. You should be aware of all the risks associated with foreign exchange trading, and seek advice from an independent financial advisor if you have any doubts.
Recommended Content
Editors’ Picks
AUD/USD keeps the red below 0.6400 as Middle East war fears mount

AUD/USD is keeping heavy losses below 0.6400, as risk-aversion persists following the news that Israel retaliated with missile strikes on a site in Iran. Fears of the Israel-Iran strife translating into a wider regional conflict are weighing on the higher-yielding Aussie Dollar.
USD/JPY recovers above 154.00 despite Israel-Iran escalation

USD/JPY is recovering ground above 154.00 after falling hard on confirmation of reports of an Israeli missile strike on Iran, implying that an open conflict is underway and could only spread into a wider Middle East war. Safe-haven Japanese Yen jumped, helped by BoJ Governor Ueda's comments.
Gold price pares gains below $2,400, geopolitical risks lend support

Gold price is paring gains to trade back below $2,400 early Friday, Iran's downplaying of Israel's attack has paused the Gold price rally but the upside remains supported amid mounting fears over a potential wider Middle East regional conflict.
WTI surges to $85.00 amid Israel-Iran tensions

Western Texas Intermediate, the US crude oil benchmark, is trading around $85.00 on Friday. The black gold gains traction on the day amid the escalating tension between Israel and Iran after a US official confirmed that Israeli missiles had hit a site in Iran.
Dogwifhat price pumps 5% ahead of possible Coinbase effect

Dogwifhat price recorded an uptick on Thursday, going as far as to outperform its peers in the meme coins space. Second only to Bonk Inu, WIF token’s show of strength was not just influenced by Bitcoin price reclaiming above $63,000.