![]() Mike “Mish” Shedlock's
Mike “Mish” Shedlock's
Sitka Pacific Capital Management,Llc
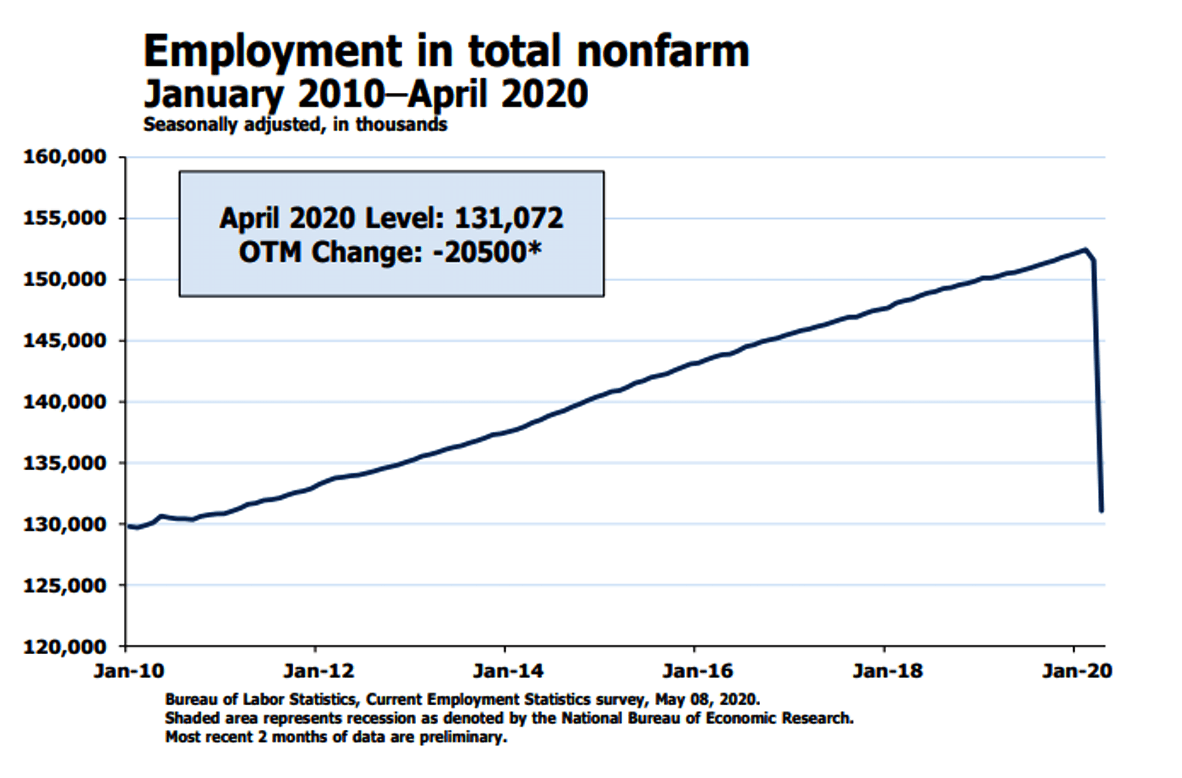
The unemployment rate jump to 14.7% as nonfarm payrolls declined by 20.5 million jobs.
This was the most distorted BLS report in history.
Initial Reaction
The headline jobs number fell by 20.5 million and the unemployment rate jumped 10.3 percentage points to 14.7% according to the BLS Employment Report.
The 10.PP jump and the number of jobs lost were the most in history. The average workweek rose, at least for those still working.
Special Instructions
The BLS had "special instruction" this month but the answers came out wrong anyway.
As was the case in March, special instructions sent to household survey interviewers called for all employed persons absent from work due to coronavirus-related business closures to be classified as unemployed on temporary layoff. However, it is apparent that not all such workers were so classified.
If the workers who were recorded as employed but absent from work due to “other reasons” (over and above the number absent for other reasons in a typical April) had been classified as unemployed on temporary layoff, the overall unemployment rate would have been almost 5 percentage points higher than reported (on a not seasonally adjusted basis). However, according to usual practice, the data from the household survey are accepted as recorded. To maintain data integrity, no ad hoc actions are taken to reclassify survey responses.
Add 5 percentage to the total for the real answer. The unemployment rate was almost 20%.
Seasonal Adjustments Gone Haywire
Inquiring minds may also be interested in Seasonal Adjustments and other changes the BLS made in its special report The impact of the coronavirus (COVID-19) pandemic on The Employment Situation for April 2020.
During their review of household survey data for April, BLS staff tested for outliers to determine whether any changes were needed to the seasonal adjustment models. BLS staff determined that the vast majority of household survey data series had significant outliers in April and manually added outlier terms to the seasonal adjustment models.
Seasonal adjustment factors can be either multiplicative or additive. A multiplicative seasonal effect is assumed to be proportional to the level of the series. A sudden large increase in the level of the series will be accompanied by a proportionally large seasonal effect. In contrast, an additive seasonal effect is assumed to be unaffected by the level of the series. In times of relative economic stability, the multiplicative option is generally preferred over the additive option. However, in the presence of a large level shift in a time series, multiplicative seasonal adjustment factors can result in systematic over- or under-adjustment of the series; in such cases, additive seasonal adjustment factors are preferred since they tend to more accurately track seasonal fluctuations in the series and have smaller revisions.
Most household data series that had outliers in April used multiplicative seasonal adjustment factors. Therefore, BLS staff decided to specify all series with significant April outliers as additive. In accordance with the household survey’s usual practice, the seasonal adjustment models and factors will be reviewed at the end of the calendar year, when five years of seasonally adjusted estimates will be subject to revision.
Job Revisions
The change in total nonfarm payroll employment for February was revised down by 45,000 from +275,000 to +230,000, and the change for March was revised down by 169,000 from -701,000 to -870,000. With these revisions, employment changes in February and March combined were 214,000 lower than previously reported.
BLS Jobs Statistics at a Glance
- Nonfarm Payroll: -701,000 - Establishment Survey
- Private Nonfarm Payroll: -713,000 - Establishment Survey
- Employment: -2,987,000 - Household Survey
- Unemployment: +1,353,000 - Household Survey
- Involuntary Part-Time Work: +1,267,000 - Household Survey
- Voluntary Part-Time Work: -1,574,000 - Household Survey
- Baseline Unemployment Rate: +0.9 to 4.4% - Household Survey
- U-6 unemployment: +1.7 to 8.7% - Household Survey
- Civilian Non-institutional Population: +130,0000
- Civilian Labor Force: -1,633,000 - Household Survey
- Not in Labor Force: +1,763,000 - Household Survey
- Participation Rate: -0.7 to 62.7% - Household Survey
BLS Employment Report Statement
Total nonfarm payroll employment fell by 20.5 million in April, and the unemployment rate rose to 14.7 percent, the U.S. Bureau of Labor Statistics reported today. The changes in these measures reflect the effects of the coronavirus (COVID-19) pandemic and efforts to contain it. Employment fell sharply in all major industry sectors, with particularly heavy job losses in leisure and hospitality.
Unemployment Rate – Seasonally Adjusted
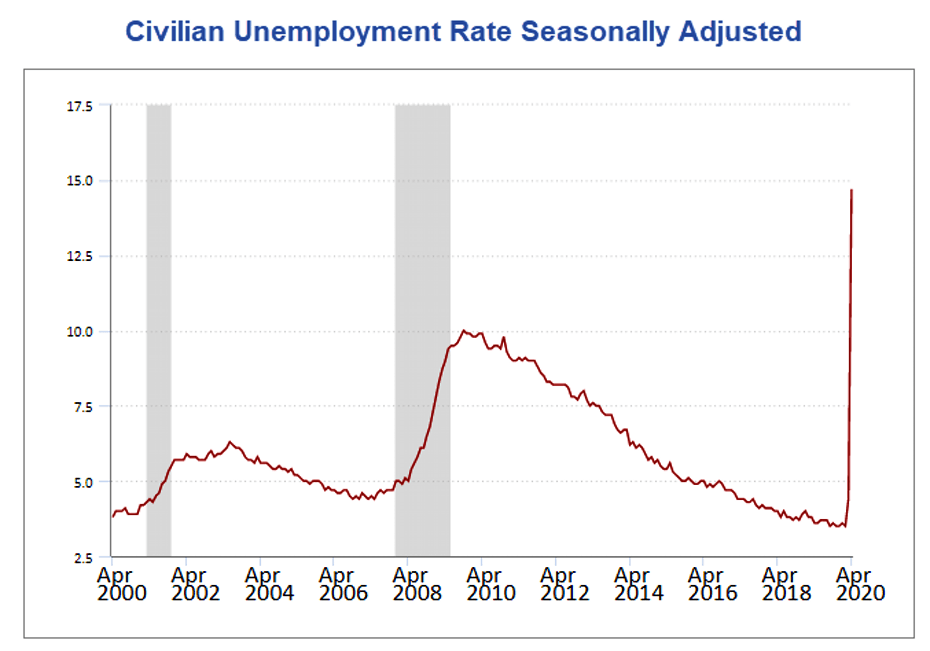
The above Unemployment Rate Chart is from the BLS. Click on the link for an interactive chart.
Month-Over Month Changes by Job Type
Hours and Wages
Average weekly hours of all private employees rose 0.1 hours to 34.2 hours. Average weekly hours of all private service-providing employees rose 0.5 hours to 33.4 hours. Average weekly hours of manufacturers fell 0.3 hours to at 40.4 hours.
Average Hourly Earnings of All Nonfarm Workers rose $1.34 to $30.01 . That's an amazing gain of 4.67%.
Average hourly earnings of Production and Supervisory Workers rose $1.04 to $25.12. That's an amazing .32% gain.
Year-Over-Year Wage Growth
- All Private Nonfarm rose from $27.81 to $30.01 a gain of 7.9%.
- Production and supervisory rose from $23.33 to $25.12 a gain of 7.7%.
Birth Death Model
Starting January 2014, I dropped the Birth/Death Model charts from this report. For those who follow the numbers, I retain this caution: Do not subtract the reported Birth-Death number from the reported headline number. That approach is statistically invalid. Should anything interesting arise in the Birth/Death numbers, I will comment further.
I am prepared to comment further for the first time in over 6 years.
BLS Special Statement on the Birth-Death Model
The BLS changed the estimation method used in the establishment survey for April. Business births and deaths cannot be adequately captured by the establishment survey as they occur. Therefore, the establishment survey estimates use a model to account for the relatively stable net employment change generated by business births and deaths. Due to the impact of the COVID-19 pandemic, the relationship between the two was no longer stable in April. Therefore, the establishment survey made changes to the birth-death model. These changes include using a portion of business deaths reported by establishments in the estimation process. These business deaths are normally excluded from the estimation process. BLS also added a regression variable to the model for forecasting net business births and deaths. The regression variable added more recent information to the model, which typically relies on inputs only available on a lag of several months. The establishment survey also uses outlier detection as a usual part of the seasonal adjustment process. All outliers for seasonal adjustment are identified on a monthly basis in the establishment survey seasonal adjustment documentation.
The Birth-Death model is officially garbage, much more than normal, but we likely will not find how distorted this is until the annual revisions next year.
Table 15 BLS Alternative Measures of Unemployment
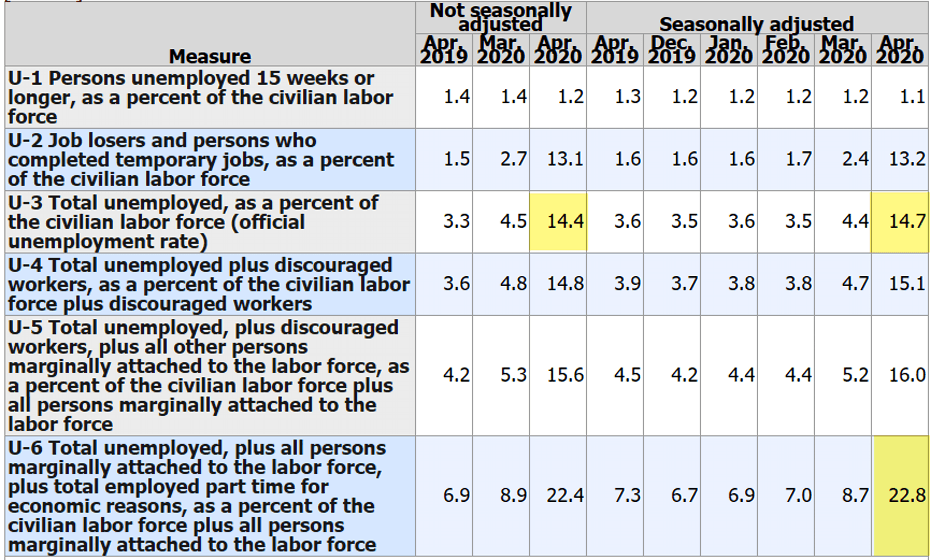
Table A-15 is where one can find a better approximation of what the unemployment rate really is.
Notice I said “better” approximation not to be confused with “good” approximation.
The official unemployment rate is 14.7%. However, if you start counting all the people who want a job but gave up, all the people with part-time jobs that want a full-time job, all the people who dropped off the unemployment rolls because their unemployment benefits ran out, etc., you get a closer picture of what the unemployment rate is. That number is in the last row labeled U-6.
U-6 is much higher at 22.8%. Both numbers would be way higher still, were it not for millions dropping out of the labor force over the past few years.
Some of those dropping out of the labor force retired because they wanted to retire. The rest is disability fraud, forced retirement, discouraged workers, and kids moving back home because they cannot find a job.
Strength is Relative
It’s important to put the jobs numbers into proper perspective.
In the household survey, if you work as little as 1 hour a week, even selling trinkets on eBay, you are considered employed.
In the household survey, if you work three part-time jobs, 12 hours each, the BLS considers you a full-time employee.
In the payroll survey, three part-time jobs count as three jobs. The BLS attempts to factor this in, but they do not weed out duplicate Social Security numbers. The potential for double-counting jobs in the payroll survey is large.
Household Survey vs. Payroll Survey
The payroll survey (sometimes called the establishment survey) is the headline jobs number, generally released the first Friday of every month. It is based on employer reporting.
The household survey is a phone survey conducted by the BLS. It measures unemployment and many other factors.
If you work one hour, you are employed. If you don’t have a job and fail to look for one, you are not considered unemployed, rather, you drop out of the labor force.
Looking for jobs on Monster does not count as “looking for a job”. You need an actual interview or send out a resume.
These distortions artificially lower the unemployment rate, artificially boost full-time employment, and artificially increase the payroll jobs report every month.
Final Thoughts
Once again, due Covid-19, this report does not properly reflect the massive amount of layoffs that have taken place.
As noted above, the BLS believes the unadjusted unemployment rate to be about 5 percentage points higher. That means 19.4% as opposed to 14.4%.
Instead the BLS took 14.4%, factred in a doctored up Birth-Death model and concocted a seasonally-adjusted unemployment rate of 14.7%.
We will not find out how distorted this all is until the next set of annual revisions.
This material is based upon information that Sitka Pacific Capital Management considers reliable and endeavors to keep current, Sitka Pacific Capital Management does not assure that this material is accurate, current or complete, and it should not be relied upon as such.
Recommended Content
Editors’ Picks
EUR/USD rises toward 1.0700 after Germany and EU PMI data

EUR/USD gains traction and rises toward 1.0700 in the European session on Monday. HCOB Composite PMI data from Germany and the Eurozone came in better than expected, providing a boost to the Euro. Focus shifts US PMI readings.
GBP/USD holds above 1.2350 after UK PMIs

GBP/USD clings to modest daily gains above 1.2350 in the European session on Tuesday. The data from the UK showed that the private sector continued to grow at an accelerating pace in April, helping Pound Sterling gather strength.
Gold price flirts with $2,300 amid receding safe-haven demand, reduced Fed rate cut bets

Gold price (XAU/USD) remains under heavy selling pressure for the second straight day on Tuesday and languishes near its lowest level in over two weeks, around the $2,300 mark heading into the European session.
Here’s why Ondo price hit new ATH amid bearish market outlook Premium

Ondo price shows no signs of slowing down after setting up an all-time high (ATH) at $1.05 on March 31. This development is likely to be followed by a correction and ATH but not necessarily in that order.
US S&P Global PMIs Preview: Economic expansion set to keep momentum in April

S&P Global Manufacturing PMI and Services PMI are both expected to come in at 52 in April’s flash estimate, highlighting an ongoing expansion in the private sector’s economic activity.