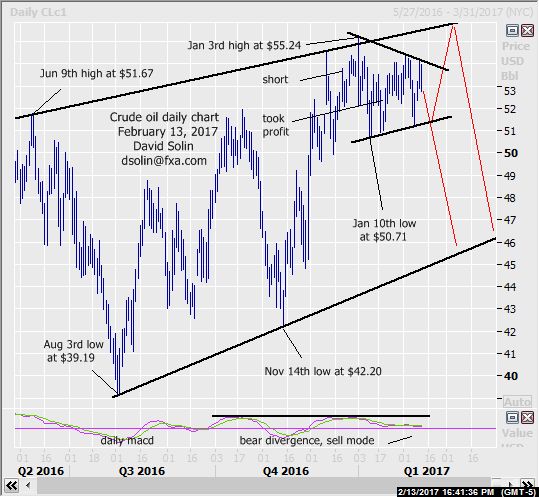
Near term crude oil outlook:
No change as the market remains in that $55.25/$50.71 range that has been in place since Jan 3rd. Still seen as a large topping near the ceiling of the rising wedge pattern since Jun, and with eventual declines to the base/bullish trendline from Aug (currently at $44.50/00). However as been discussing for some time, there is no confirmation of such a top "pattern-wise" (5 waves down for example), leaving open scope for a further period of this ranging and even a retest of the ceiling of the wedge before finally rolling over (see in red on daily chart below). Also may be forming a triangle/pennant from that Jan high, generally seen as a continuation pattern and adds to the near term risk of a final pop above that $55.25 to that ceiling of the wedge (currently at $55.50/00) and before rolling over (triangles are generally viewed as continuation patterns). Nearby support is seen at $52.50/75 and the base of the triangle (currently at $51.10/35, close below would argue a larger rolling over). Nearby resistance is seen at the ceiling/bearish trendline from Jan 3rd (currently at $51.10/35). Bottom line: view of an important top/topping and eventual declines to the bull trendline from Aug/base of rising wedge (currently at $44.50/00) remains, but still risk for a further period of topping first.
Strategy/position:
With scope for more ranging and even a retest of the ceiling of the huge wedge (and only if more aggressive), would now buy $0.25 above the base of the triangle and then initially stopping on a close $0.25 below. However with such upside likely limited/short-lived (in the bigger picture), will want to get much more aggressive with stops on nearby gains and especially an upside resolution of the triangle/bear trendline from the Jan high (to maintain a good risk/reward in the position).
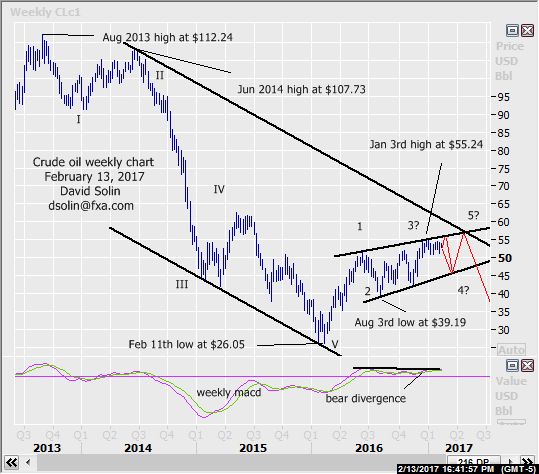
Long term outlook:
As discussed above, no change as the market continues to form that large rising wedge pattern since last June. Seen as a topping/reversal pattern and along with technicals that have not confirmed the last few months of gains and generally poor upside momentum, suggests a more significant topping. Note too that the longer term market remains bearish from a "simple" supply/demand standpoint as EIA inventories remain well above their 5 year average and are pushing back to their June peaks (see 3rd chart below). But wedge patterns break down into 5 legs and in turn leaves open scope for a more extended period of ranging (at least another few months) before finally rolling/resolving lower (see in red on weekly chart/'2nnd chart below). Long term resistance above the ceiling of the wedge is seen at seen at $59.00/25 (38% retracement from the Aug 2013 high at $112.24) and the ceiling of the bearish channel from Jun 2014 (currently at $60.75/25). Bottom line: important topping near the ceiling of the rising wedge since June but scope for at least another few months of large swings in both directions in the pattern before finally rolling over.
Strategy/position:
With a potentially more important top also forming, would await higher confidence of at least a short term top before entering.
Recommended Content
Editors’ Picks
EUR/USD faces a minor resistance near at 1.0750

EUR/USD quickly left behind Wednesday’s small downtick and resumed its uptrend north of 1.0700 the figure, always on the back of the persistent sell-off in the US Dollar ahead of key PCE data on Friday.
GBP/USD returns to 1.2500 area in volatile session

GBP/USD reversed its direction and recovered to 1.2500 after falling to the 1.2450 area earlier in the day. Although markets remain risk-averse, the US Dollar struggles to find demand following the disappointing GDP data.
Gold holds around $2,330 after dismal US data

Gold fell below $2,320 in the early American session as US yields shot higher after the data showed a significant increase in the US GDP price deflator in Q1. With safe-haven flows dominating the markets, however, XAU/USD reversed its direction and rose above $2,340.
Bitcoin price continues to get rejected from $65K resistance as SEC delays decision on spot BTC ETF options

Bitcoin (BTC) price has markets in disarray, provoking a broader market crash as it slumped to the $62,000 range on Thursday. Meanwhile, reverberations from spot BTC exchange-traded funds (ETFs) continue to influence the market.
US economy: slower growth with stronger inflation

The dollar strengthened, and stocks fell after statistical data from the US. The focus was on the preliminary estimate of GDP for the first quarter. Annualised quarterly growth came in at just 1.6%, down from the 2.5% and 3.4% previously forecast.