![]() Steven Mylonas
Steven Mylonas
Bottomcatcher.com
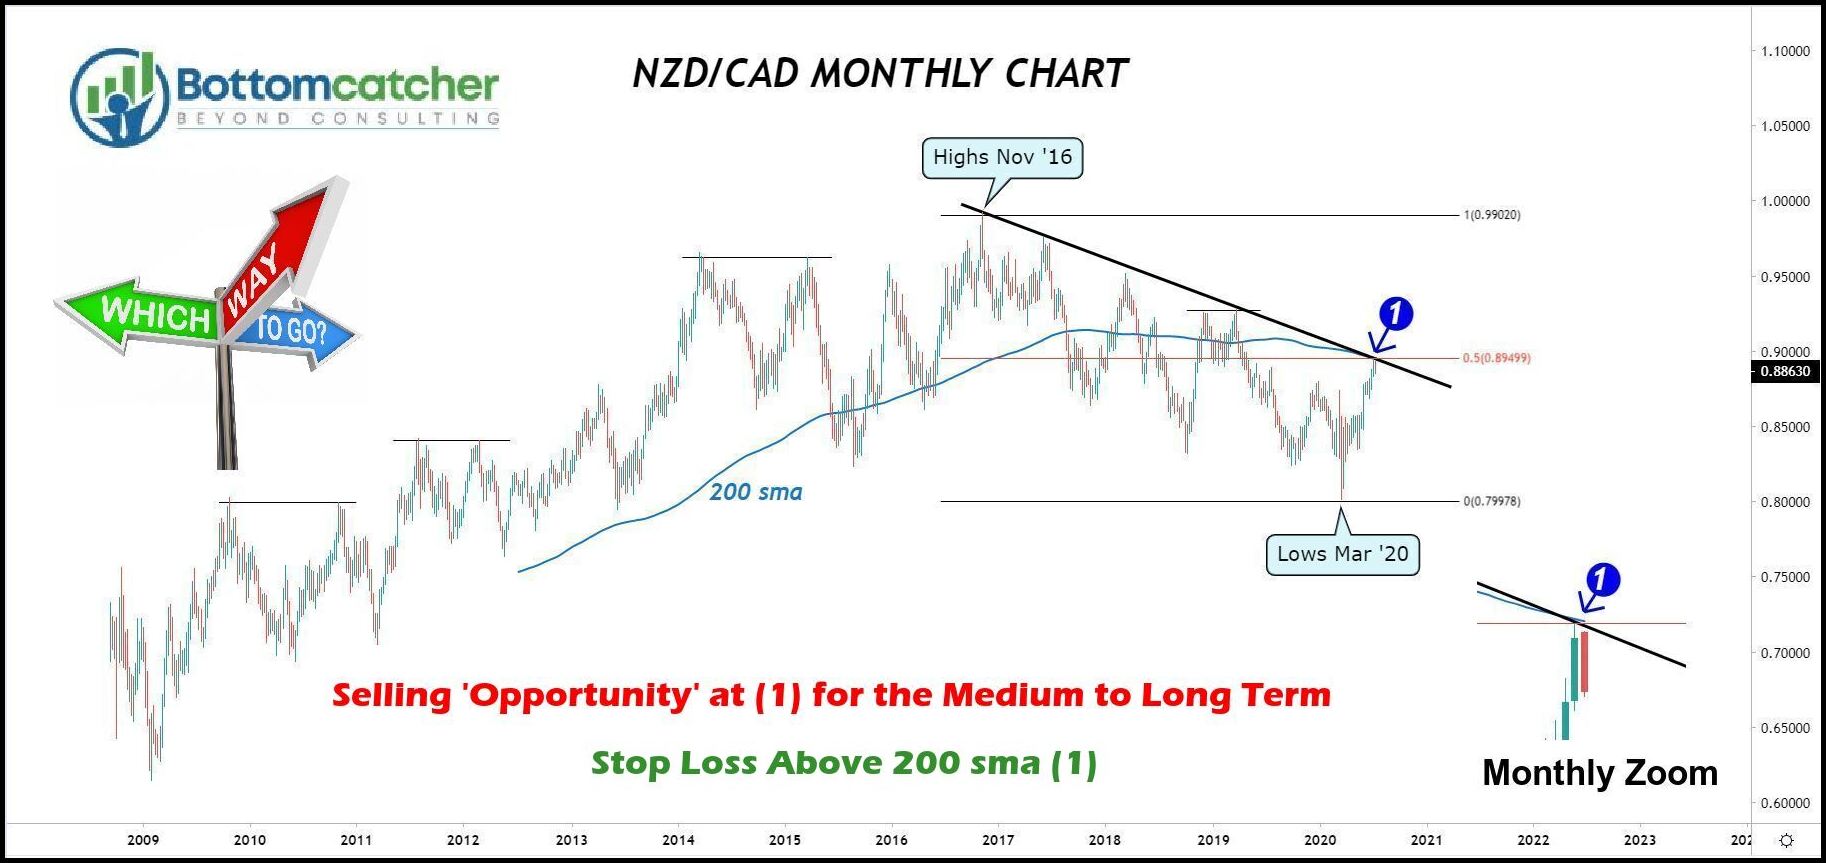
The NZD/CAD currency pair has been in a long term downtrend since the highs of November 2016, creating lower swing highs along the way. From the March lows this year the NZD/CAD has enjoyed a robust rally which lasted up until the end of last month where it tested a strategic resistance zone comprised of the 200 period monthly moving average, 50% fib level (taken from the highs of November 2016 and the lows of March this year) and descending trend line, which all junction at (1).
Selling pressure has been clear over the past two weeks, proving this triple resistance cluster (1) was indeed a good selling opportunity ‘at least' for the short term (up to 3 weeks). For a longer-term outlook this could be taken as confirmation that perhaps another leg down is underway. Longer-term short sellers can benefit from a good risk/reward perspective around these current levels by allocating their stop just above the 200 SMA at (1). However, the bulls, on the other hand, will be expecting this decline over the past two weeks to be nothing more than a shallow profit-taking pullback. A noticeable ‘W' shape bullish recovery pattern which began on the 1st of May this year and completes back at the May highs also adds weight to the bulls hypothesis.
Bottomcatcher has made every attempt to ensure the accuracy and reliability of the information provided in this report. However, the information is provided without a warranty of any kind. Views expressed in this report may be subject to change without prior notice and may differ or be contrary to opinions expressed by Bottomcatcher.
Recommended Content
Editors’ Picks
AUD/USD could extend the recovery to 0.6500 and above

The enhanced risk appetite and the weakening of the Greenback enabled AUD/USD to build on the promising start to the week and trade closer to the key barrier at 0.6500 the figure ahead of key inflation figures in Australia.
EUR/USD now refocuses on the 200-day SMA

EUR/USD extended its positive momentum and rose above the 1.0700 yardstick, driven by the intense PMI-led retracement in the US Dollar as well as a prevailing risk-friendly environment in the FX universe.
Gold struggles around $2,325 despite broad US Dollar’s weakness

Gold reversed its direction and rose to the $2,320 area, erasing a large portion of its daily losses in the process. The benchmark 10-year US Treasury bond yield stays in the red below 4.6% following the weak US PMI data and supports XAU/USD.
Bitcoin price makes run for previous cycle highs as Morgan Stanley pushes BTC ETF exposure

Bitcoin (BTC) price strength continues to grow, three days after the fourth halving. Optimism continues to abound in the market as Bitcoiners envision a reclamation of previous cycle highs.
US versus the Eurozone: Inflation divergence causes monetary desynchronization

Historically there is a very close correlation between changes in US Treasury yields and German Bund yields. This is relevant at the current juncture, considering that the recent hawkish twist in the tone of the Federal Reserve might continue to push US long-term interest rates higher and put upward pressure on bond yields in the Eurozone.