December’s Five Wave Uptrend Tests Upside Targets – Preparing for Counter-Trend Downswing!!
The following is an extract from our Institutional Stock Index Report published Thursday January 17th 2019
-
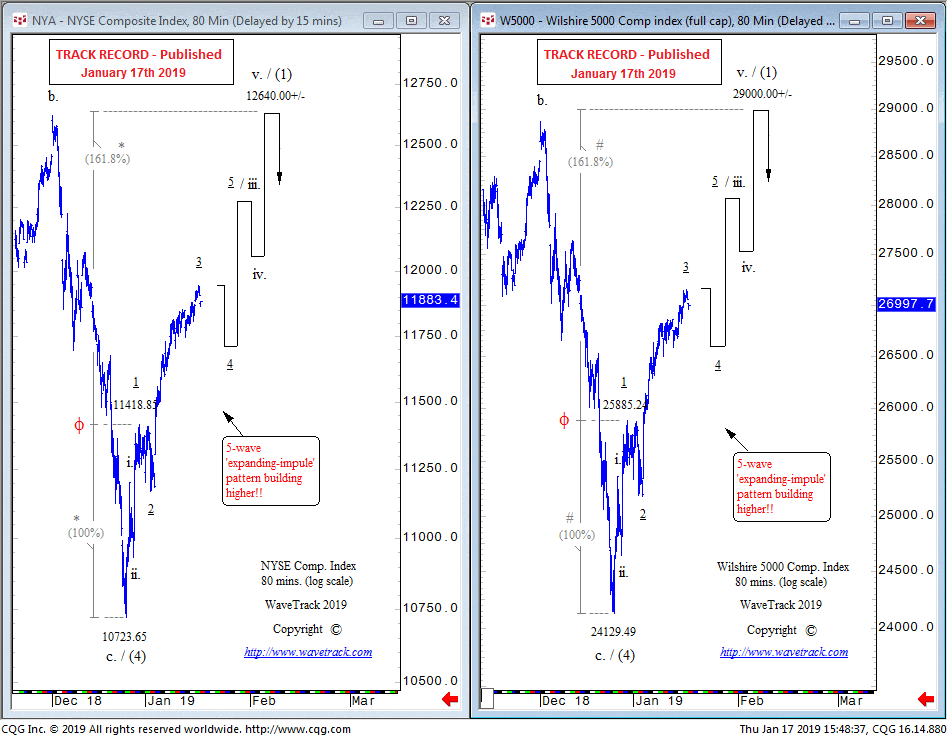
December’s rally in the NYSE Composite and Wilshire 5000 indices are both unfolding into a five wave ‘expanding-impulse’ patterns – this means the December low ended 2018’s correction ahead of the S&P 500 and Nikkei – shorter-term, this impulse pattern remains incomplete with upside targets around +11% per cent higher – this is directly comparable to the Nikkei’s +7% upswing basis the performance ratio of 1:1.7 - only when completed do we expect to see the S&P 500 and Nikkei begin one additional and final decline for the diagonal pattern – the NYSE Composite and Wilshire 5000 indices synchronise as they begin a 2nd wave correction
Wednesday’s mid-week Elliott Wave Navigator Supplemental report commented that two peripheral U.S. indices, the NYSE Composite and Wilshire 5000 indices were exhibiting characteristic qualities of ‘price-expansion’ since pushing higher from the secondary lows of early-January. This is typically 3rd wave activity within an uptrend – see fig #1.
These advances began with a step-like movement of three price-swings which can easily be identifiably mistaken as a three wave correction within an existing downtrend. But these are a bullish 1-2-1 sequence ahead of a 3rd-of-3rd price advance which has now unfolded to current levels. To complete the entire five wave pattern, it must continue as a 4-5-4-5 sequence – we’ve extending the 1-2-1 by a fib. 161.8% ratio which projects towards 12640.00+/- for the NYSE Comp. index and 29000.00+/- for the Wilshire 5000 Comp. index.
Conclusion
There’s been much talk since early-January of a new secular-bear downtrend beginning from October’s highs – we have consistently shown various economic data with Elliott Wave overlays how this is an erroneous call – see WaveTrack's annual Stock Indices 2019 Outlook.
If the NYSE Composite and Wilshire 5000 indices unfold over the next couple of weeks as we show here, then, the secular-bull uptrend will be confirmed.
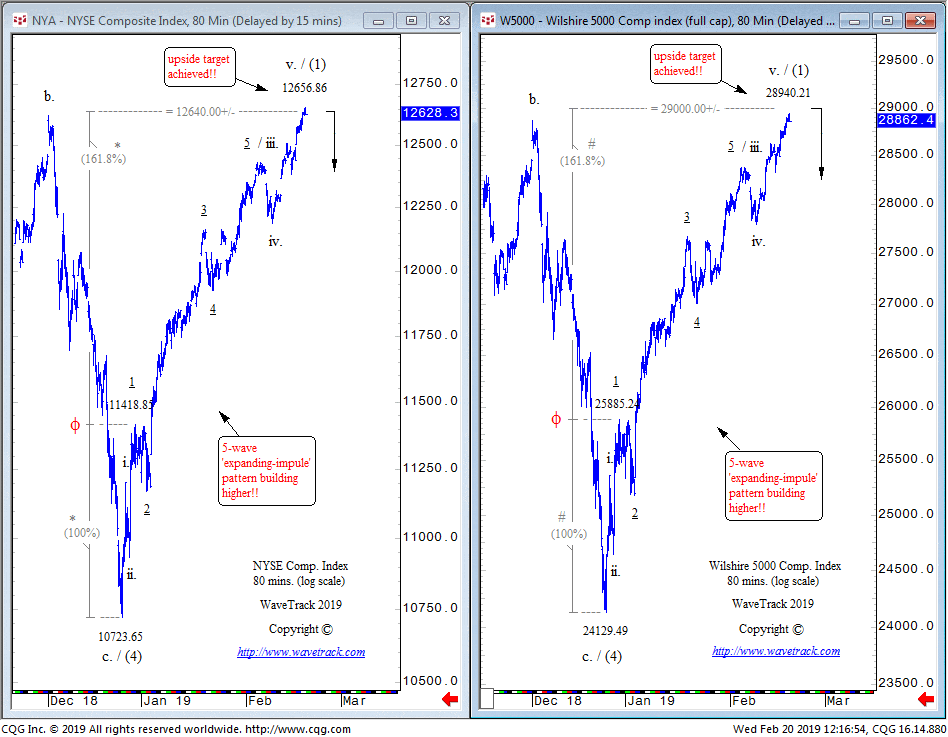
Result! Wednesday 20th February Update
December’s Five Wave Uptrend Tests Upside Targets – Preparing for Counter-Trend Downswing!! See fig #2.
Subscribe and get the latest forecasts on Stocks, FX & Commodities – NOW!
WaveTrack International and its related publications apply R.N.Elliott's "The Wave Principle" to historical market price activity which categorises and interprets the progress of future price patterns according to this methodology. Whilst it may be reasonable to deduce a course of action regarding investments as a result of such application, at no time or on any occasion will specific securities, futures, options or commodities of any kind be recommended for purchase or sale. Publications containing forecasts are therefore intended for information purposes only. Any opinion contained in these reports is only a statement of our views and are based on information we believe to be reliable but no guarantee is given as to its accuracy or completeness. Markets are volatile and therefore subject to rapid an unexpected price changes. Any person relying on information contained in these reports does so at their own risk entirely and no liability is accepted by WaveTrack in respect thereof. © All rights are copyrights to WaveTrack. Reproduction and / or dissemination without WaveTrack's prior consent is strictly forbidden. We encourage reviews, quotation and reference but request that full credit is given.
Recommended Content
Editors’ Picks
AUD/USD hovers around 0.6500 amid light trading, ahead of US GDP

AUD/USD is trading close to 0.6500 in Asian trading on Thursday, lacking a clear directional impetus amid an Anzac Day holiday in Australia. Meanwhile, traders stay cautious due ti risk-aversion and ahead of the key US Q1 GDP release.
USD/JPY finds its highest bids since 1990, near 155.50

USD/JPY keeps breaking into its highest chart territory since June of 1990 early Thursday, testing 155.50 for the first time in 34 years as the Japanese Yen remains vulnerable, despite looming Japanese intervention risks. Focus shifts to Thursday's US GDP report and the BoJ decision on Friday.
Gold price lacks firm intraday direction, holds steady above $2,300 ahead of US data

Gold price remains confined in a narrow band for the second straight day on Thursday. Reduced Fed rate cut bets and a positive risk tone cap the upside for the commodity. Traders now await key US macro data before positioning for the near-term trajectory.
Injective price weakness persists despite over 5.9 million INJ tokens burned

Injective price is trading with a bearish bias, stuck in the lower section of the market range. The bearish outlook abounds despite the network's deflationary efforts to pump the price. Coupled with broader market gloom, INJ token’s doomed days may not be over yet.
Meta Platforms Earnings: META sinks 10% on lower Q2 revenue guidance Premium

This must be "opposites" week. While Doppelganger Tesla rode horrible misses on Tuesday to a double-digit rally, Meta Platforms produced impressive beats above Wall Street consensus after the close on Wednesday, only to watch the share price collapse by nearly 10%.

