JPN225 and USDJPY, H4 and Daily
US equities extended their rout ahead of the close with major indices down 2.3-4.0%, but the Nasdaq suffered the most, free-falling 4.1%, or 316 points to 7,422. To recap, high yields, China trade war, Fed tightening fears, tech wobble, etc. have conspired to relieve investors of some of their complacency. Leveraged, macro- and real-money fund liquidation would not surprise amid this rebalancing, not to mention flight from the hotter fast-money algo/system traders.
Added to the mix late was news that the US Justice Department charged a Chinese intelligence officer, Yanjun Xu, of economic espionage for theft of trade secrets from leading US aerospace companies. This news is hardly likely to tamp down rising Sino-US trade/tariff animosity.
Topix and JPN225 are down -3.75% and -4.19% respectively. This was the largest one day decline since March 1. Rising yields and earnings reports that start to reflect the impact of the trade war triggered the initial wave of selling, and with investors heading for safety bond yields are coming down. Global central banks may still sound optimistic on growth and remain on course for further tightening, but markets are taking cover as growth concerns spike amid geopolitical trade tensions.
JPN225
The JPN225 despite the sharp sell off, manage to remain above the 22154 hurdle, which is the September’s low, but also remain on truck with the upside trendline set since March bottom by connecting the higher low daily fractals. Even-though the aggressive sell off could alert that the negative momentum would continue, the fact that remains above the September hurdle, the 200-day EMA, but more interestingly that it is currently outside Bollinger Band pattern, indicates that in the near term is likely to see correction to the upside. An opening outside Bollinger bands pattern theoretically suggest a return back to the mean line or at least within the pattern area.
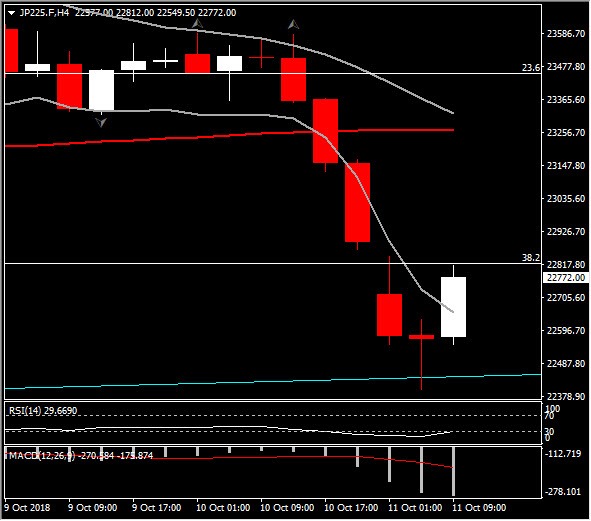
Daily technical indicators confirm more bearish bias for the index: the RSI dropped from 79 high to 36, with further steam to the downside, while the MACD is decreasing significantly below the signal line but still stands within the positive area. In the 4-hour chart, technical indicators present a mixed outlook. RSI moves within the oversold territory, but sloping positively after the rebound from 19 low, suggesting short term strength for index. MACD on the other hand, slipped below signal line and below neutral zone, something that implies that negative momentum could increase further.
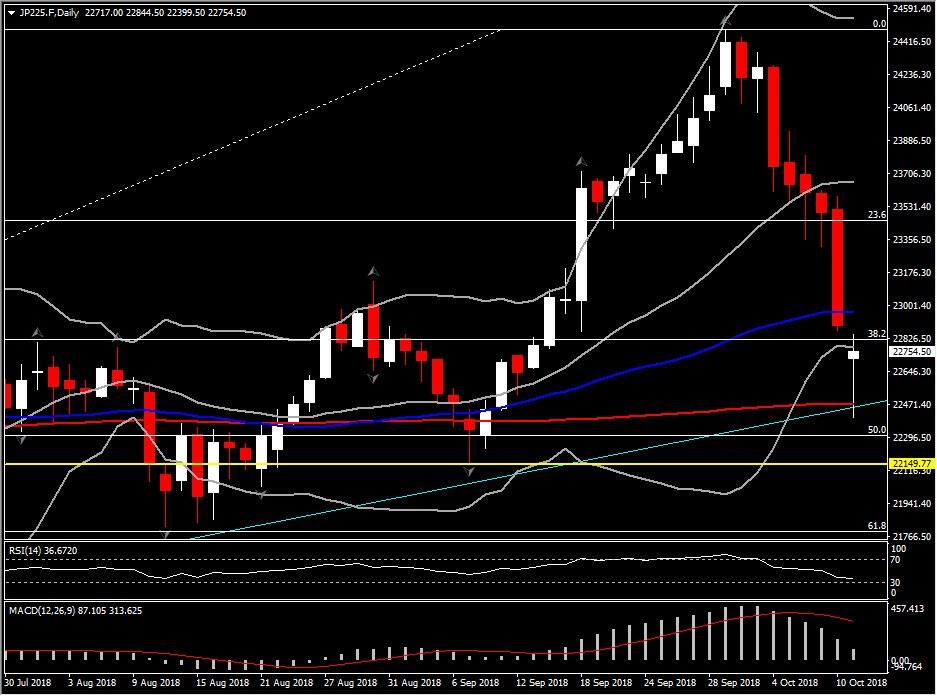
To recap, in the longterm JPN225’s outlook remains positive as prices hold above the trendline set since March bottom, above the 200-day SMA but also above September’s low at 22154.00. Declines below this level, will form a bearish rounding top pattern, while this will mean that 50% Fib. level and 200-day EMA broke. The reach and the break of the latter could challenge to the 21790.00 level, which coincides with 61.8% Fibonacci retracement level and August Support.
However, this overextended move could also be followed by a rebound. In such a scenario, only a significant close above 2300.00 would imply that bulls are back in the market. This could lead the asset back in the upside channel, with the next Resistance at 23.6% fib level, at 23450.00, which is also the mid of October’s decline.
Within the day meanwhile, a closing above the 22867, which will fill the gap could suggest a retest of the PP level at 23140.00. Intraday immediate Support holds at 22395.00 and Resistance at 22847.00.
USDJPY
As it is widely known that Nikkei ( JPN225) and Yen are negatively correlated, so as JPN225 , the Yen outperform. This is today’s theme as well as USDJPY has posted a 3-week low at 111.97, since the Yen picked up safe haven demand. The USDJPY formed 5 daily bearish candles, while it is currently moving within the lower Bollinger Band pattern, challenging the 50-day SMA Support level, at 111.80.
Meanwhile technical indicators in the daily time-frame but intraday as well, strongly support that the negative outlook is likely to continue in the near future. In the 4-hour chart, MACD lines are extended lower , below trigger line and neutral zone. Intraday Support levels are set at 111.80 and 111.55, while Resistance is set at 112.60. If price turns up to Resistance, the confluence of 20-period SMA, R1 and FE61.8 level could offer the next Resistance level for the asset price, at 112.90.

Disclaimer: Nothing in this communication contains, or should be considered as containing, an investment advice or an investment recommendation or a solicitation for the purpose of purchase or sale of any financial instrument.
Recommended Content
Editors’ Picks
EUR/USD retreats below 1.0700 after US GDP data

EUR/USD came under modest bearish pressure and retreated below 1.0700. Although the US data showed that the economy grew at a softer pace than expected in Q1, strong inflation-related details provided a boost to the USD.
GBP/USD declines below 1.2500 as USD rebounds

GBP/USD declined below 1.2500 and erased the majority of its daily gains with the immediate reaction to the US GDP report. The US economy expanded at a softer pace than expected in Q1 but the price deflator jumped to 3.4% from 1.8%.
Gold holds near $2,330 despite rising US yields

Gold stays in positive territory near $2,330 in the second half of the day on Thursday. The benchmark 10-year US Treasury bond yield is up more than 1% on the day above 4.7% after US GDP report, making it difficult for XAU/USD to extend its daily rally.
XRP extends its decline, crypto experts comment on Ripple stablecoin and benefits for XRP Ledger

Ripple extends decline to $0.52 on Thursday, wipes out weekly gains. Crypto expert asks Ripple CTO how the stablecoin will benefit the XRP Ledger and native token XRP.
After the US close, it’s the Tokyo CPI

After the US close, it’s the Tokyo CPI, a reliable indicator of the national number and then the BoJ policy announcement. Tokyo CPI ex food and energy in Japan was a rise to 2.90% in March from 2.50%.