New Fed Chair wants to move the inflation goal posts
What do you do if you have a standard that’s not being met?
Move the goalposts!
Of course, you could work harder to meet the goal. But that’s hard. So, why not just change the standard and make it easier to meet?
That seems to be a strategy at the Federal Reserve.
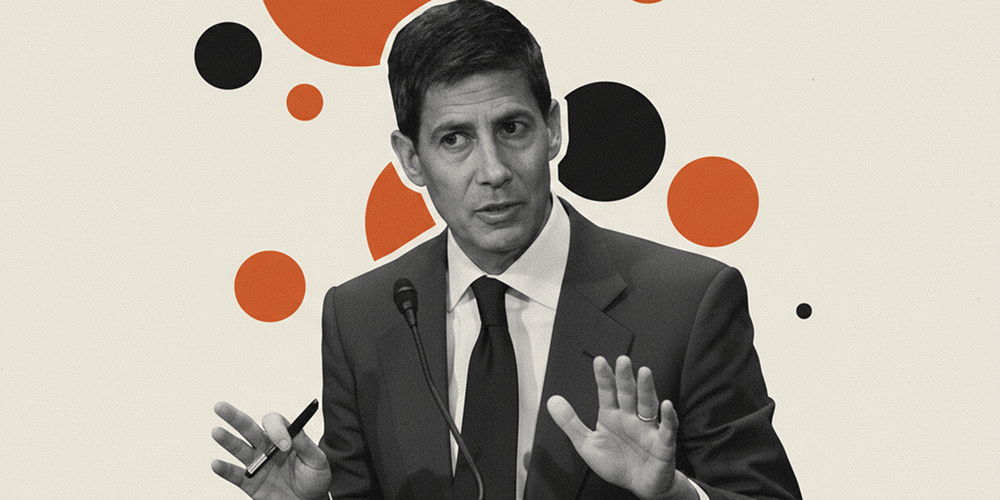
During his confirmation hearing. New Federal Reserve Chairman Kevin Warsh indicated that he preferred “trimmed averages” for price inflation.
As Reuters explained, in theory, this approach “trims off the fastest-rising prices and fastest-falling prices, leaving a more representative middle set of price changes that typically serves as a good indicator of where inflation is heading.”
But in reality, these analysts are simply removing important data points from consideration.
A trimmed average is determined by removing the high and low numbers in a series before averaging.
For instance, consider this series:
1, 8, 10, 12, 11, 7, 15, 25
The average of this series is 11.1.
To find the trimmed average, you remove 1 and 25 and get 10.5.
Note that the trimmed average understates the true average.
This is how Warsh wants to analyze the Personal Consumption Expenditures (PCE) Price Index.
The PCE is the Fed’s favorite “inflation” measure. That’s because it understates inflation more than the CPI. A trimmed PCE would understate it even more.
You can see by this chart how much better the inflation picture looks using trimmed averages.
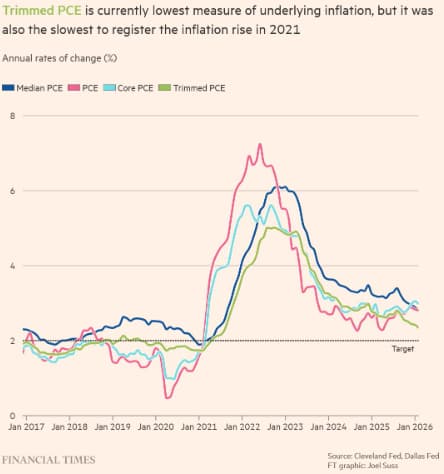
Not everyone is down with this approach. Standard Chartered Bank analysts Steve Englander and Dan Pan wrote, "We think it is difficult to argue that the disinflation signaled by the trimmed mean is real," noting that trimmed PCE has historically done a worse job of projecting price inflation than core PCE.
This isn’t the first time the powers-that-be have moved the goalposts to make the inflation picture better than it is.
In the 1990s, the government revised the CPI formula so that it understated the actual rise in prices. Based on the formula used in the 1970s, CPI is closer to double the official numbers.
Former Federal Reserve Chairman Jerome Powell also got in on the act. During his Jackson Hole speech in August 2020, Powell unveiled a policy framework based on an “average” of 2 percent inflation over time.
"In seeking to achieve inflation that averages 2 percent over time, we are not tying ourselves to a particular mathematical formula that defines the average. Thus, our approach could be viewed as a flexible form of average inflation targeting."
He went on to explain that after periods of price inflation below 2 percent, the central bank was willing to allow it to run “moderately above 2 percent some time.”
It was a convenient approach at the time. Price inflation had been running at or below 2 percent for years. By rolling out this strategy, he could plausibly tolerate some higher price inflation in the near term.
However, Powell’s averaging theory doesn’t seem to apply after inflation spikes. If it did, the Fed would now be talking about driving price inflation far below 2 percent to average out the past three-plus years of above 2 percent CPI. Nobody is suggesting this approach today. Powell's "flexible average inflation targeting" has gone the way of the Dodo bird since inflation has run far above 2 percent for years.
If you want a more realistic picture of price inflation, a new AI tool called the Reality Index analyzes raw price data without all the adjustments built into government formulas. It provides a more unfiltered look at price movements, and it reveals that things are indeed as bad as people sense.
Economist Jeffrey Tucker used the index to analyze price inflation since the pandemic lockdowns. Based on the CPI, prices are up about 26 percent. The Reality Index reveals the increase is closer to 50 percent.
This reveals the ugly truth about the Fed’s inflation tracking schemes. They aren’t interested in an honest inflation narrative. They want you to think everything is fine. They can’t make it fine, so they just move the goalposts.
To receive free commentary and analysis on the gold and silver markets, click here to be added to the Money Metals news service.
Author

Mike Maharrey
Money Metals Exchange
Mike Maharrey is a journalist and market analyst for MoneyMetals.com with over a decade of experience in precious metals. He holds a BS in accounting from the University of Kentucky and a BA in journalism from the University of South Florida.