![]() Nick Mastrandrea
Nick Mastrandrea
Market Tea Leaves
US Dollar: March USD is Up at 96.955.
Energies: March '19 Crude is Up at 52.82.
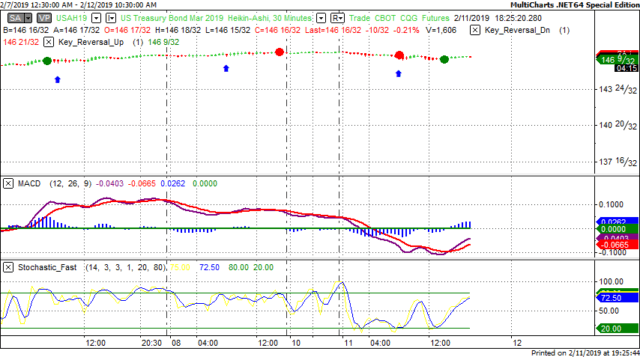
Financials: The Mar 30 year bond is Down 11 ticks and trading at 146.01.
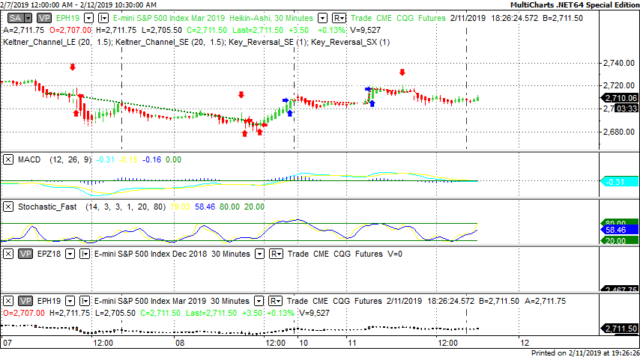
Indices: The Mar S&P 500 emini ES contract is 63 ticks Higher and trading at 2724.00.
Gold: The Feb Gold contract is trading Up at 1315.80. Gold is 38 ticks Higher than its close.
Initial Conclusion
This is not a correlated market. The dollar is Up+ and Crude is Up+ which is not normal but the 30 year Bond is trading Lower. The Financials should always correlate with the US dollar such that if the dollar is lower then bonds should follow and vice-versa. The S&P is Higher and Crude is trading Higher which is not correlated. Gold is trading Higher which is not correlated with the US dollar trading Higher. I tend to believe that Gold has an inverse relationship with the US Dollar as when the US Dollar is down, Gold tends to rise in value and vice-versa. Think of it as a seesaw, when one is up the other should be down. I point this out to you to make you aware that when we don't have a correlated market, it means something is wrong. As traders you need to be aware of this and proceed with your eyes wide open.
At this hour Asia is trading Mixed with half the exchanges trading Higher and the other half Lower. Currently all of Europe is trading Higher at this time.
Possible Challenges To Traders Today
-
NFIB Small Business Index is out at 6 AM EST. This is major.
-
JOLTS Job Openings is out at 10 AM EST. This is major.
-
Mortgage Delinquencies - tentative
-
Fed Chair Powell Speaks at 12:45 PM. This is major.
Treasuries
We've elected to switch gears a bit and show correlation between the 30 year bond (ZB) and The YM futures contract. The YM contract is the DJIA and the purpose is to show reverse correlation between the two instruments. Remember it's liken to a seesaw, when up goes up the other should go down and vice versa.
On Friday the ZB made a major move at around 8 AM EST. The ZB hit a Low at around that time and the YM hit a High. If you look at the charts below ZB gave a signal at around 8 AM EST and the YM was moving Lower at the same time. Look at the charts below and you'll see a pattern for both assets. ZB hit a Low at around 8 AM and the YM was moving Lower at the same time. These charts represent the newest version of MultiCharts and I've changed the timeframe to a 30 minute chart to display better. This represented a Long opportunity on the 30 year bond, as a trader you could have netted about a dozen ticks per contract on this trade. Each tick is worth $31.25. Please note: the front month for the ZB contract is now March, 2019
Charts Courtesy of MultiCharts built on an AMP platform.
Bias
Yesterday we gave the markets a Neutral bias as the USD was trading Higher yesterday morning but should have been trading Lower. The Dow dropped 53 points but the S&P and Nasdaq traded Higher. Today we aren't dealing with a correlated market and our bias is Neutral.
Could this change? Of Course. Remember anything can happen in a volatile market.
Commentary
Yesterday morning when we viewed the futures it seemed to gravitate to the upside but upon further investigation the USD was trading Higher when in theory it should have been trading Lower and in a truly correlated market it would have been trading Lower. This to us represented an unbalance and was the chief reason why we suggested a Neutral bias yesterday. Today we have Jolts Job Openings and Fed Chair Powell speaking, both of which are major and proven market movers.
Trading performance displayed herein is hypothetical. The following Commodity Futures Trading Commission (CFTC) disclaimer should be noted.
Hypothetical performance results have many inherent limitations, some of which are described below. No representation is being made that any account will or is likely to achieve profits or losses similar to those shown.
In fact, there are frequently sharp differences between hypothetical performance results and the actual results subsequently achieved by any particular trading program. One of the limitations of hypothetical performance trading results is that they are generally prepared with the benefit of hindsight.
In addition, hypothetical trading does not involve financial risk, and no hypothetical trading record can completely account for the impact of financial risk in actual trading. For example, the ability to withstand losses or to adhere to a particular trading program in spite of trading losses are material points which can also adversely affect actual trading results.
There are numerous other factors related to the markets in general or to the implementation of any specific trading program which cannot be fully accounted for in the preparation of hypothetical performance results and all of which can adversely affect actual trading results.
Trading in the commodities markets involves substantial risk and YOU CAN LOSE A LOT OF MONEY, and thus is not appropriate for everyone. You should carefully consider your financial condition before trading in these markets, and only risk capital should be used.
In addition, these markets are often liquid, making it difficult to execute orders at desired prices. Also, during periods of extreme volatility, trading in these markets may be halted due to so-called “circuit breakers” put in place by the CME to alleviate such volatility. In the event of a trading halt, it may be difficult or impossible to exit a losing position.
Recommended Content
Editors’ Picks
EUR/USD consolidates recovery below 1.0700 amid upbeat mood

EUR/USD is consolidating its recovery but remains below 1.0700 in early Europe on Thursday. The US Dollar holds its corrective decline amid a stabilizing market mood, despite looming Middle East geopolitical risks. Speeches from ECB and Fed officials remain on tap.
GBP/USD advances toward 1.2500 on weaker US Dollar

GBP/USD is extending recovery gains toward 1.2500 in the European morning on Thursday. The pair stays supported by a sustained US Dollar weakness alongside the US Treasury bond yields. Risk appetite also underpins the higher-yielding currency pair. ahead of mid-tier US data and Fedspeak.
Gold appears a ‘buy-the-dips’ trade on simmering Israel-Iran tensions

Gold price attempts another run to reclaim $2,400 amid looming geopolitical risks. US Dollar pulls back with Treasury yields despite hawkish Fedspeak, as risk appetite returns.
Manta Network price braces for volatility as $44 million worth of MANTA is due to flood markets

Manta Network price is defending support at $1.80 as multiple technical indicators flash bearish. 21.67 million MANTA tokens worth $44 million are due to flood markets in a cliff unlock on Thursday.
Investors hunkering down

Amidst a relentless cautionary deluge of commentary from global financial leaders gathered at the International Monetary Fund and World Bank Spring meetings in Washington, investors appear to be taking a hiatus.