![]() Richard Perry
Richard Perry
Independent Analyst
Market Overview
An increase in risk appetite of the past couple of weeks has pulled bond yields and equity markets higher. A breakdown on gold has also been a reflection of this improvement in sentiment. This has come amidst seeming traction towards agreement on trade between the US and China. However, there has also been an improvement in economic data out of China. How major economies respond to a slow first quarter of 2019 is a key theme across global markets. As Chinese data has picked up following fiscal and monetary stimulus this is allowing traders to feel more confident for the months ahead. The focus will now be on how the Eurozone is reacting to this improvement. Flash PMIs for April will give a key indication of this. Coming into today’s session, there has been a slip back on yields, whilst equities futures are also dropping back. Perhaps Easter is an opportunity to lock in a few profits, and there is little suggestion as yet that this is a turning point. One area to potentially show some outperformance today is in the Australian dollar, with employment positive news out of Australia helping to support the Aussie. Australian unemployment may have ticked up to 5.0% (5.0% exp, 4.9% last) but with employment growth better than expected at 25,700 (+12,000 exp, +4,600 last) this is seen as key. The RBA is focusing on the labour market for its assessment of monetary policy. This data will reduce expectation of a rate cut.
Wall Street closed mildly lower last night, with the S&P 500 -0.2% at 2900, whilst US futures are lower by -0.2%. In Asia there has been a slight slip with the Nikkei -09% and the Shanghai Composite -0.3%. European markets are also a shade lower, with FTSE futures -0.1% and DAX futures -0.3%. In forex, there is a mild gain for the Japanese yen, whilst the Aussie is also outperforming on the employment data. In commodities, gold continues to slide to multi month lows, whilst oil remains in its consolidation of the past week.
The flash PMIs are in focus on the economic calendar today to give a look at how Q2 is shaping up. The Eurozone numbers for April are first up at 0900BST. Flash Eurozone Manufacturing PMI is expected to improve slightly to 47.9 (form 47.5 in March). Flash Eurozone Services PMI is expected to slip a touch to 53.2 (from an upwardly revised 53.3 in March). This would mean the Flash Eurozone Composite PMI is expected to improve slightly to 51.8 (from 51.6 in March). UK Retail Sales for March are at 0930BST and are expected to show a monthly decline of -0.3% on ex-fuel sales, although the Year on Year numbers would improve to +4.0% (from +3.8% in February). A swath of US data kicks off with Weekly Jobless Claims at 1330BST which are expected to increase slightly to 205,000 from a 49 year low of 196,000 last week. The Philly Fed Business Index is at 13330BST and is expected to slip back slightly to +10.4 (from +13.7) which would continue the recent trend lower. The US Flash PMIs are at 1445BST. US Flash Manufacturing PMI is expected to improve slightly to 52.8 (from 52.4 in March). US Flash Services PMI is expected to slip slightly to 55.0 (from 55.3 last month).
Chart of the Day – NZD/USD
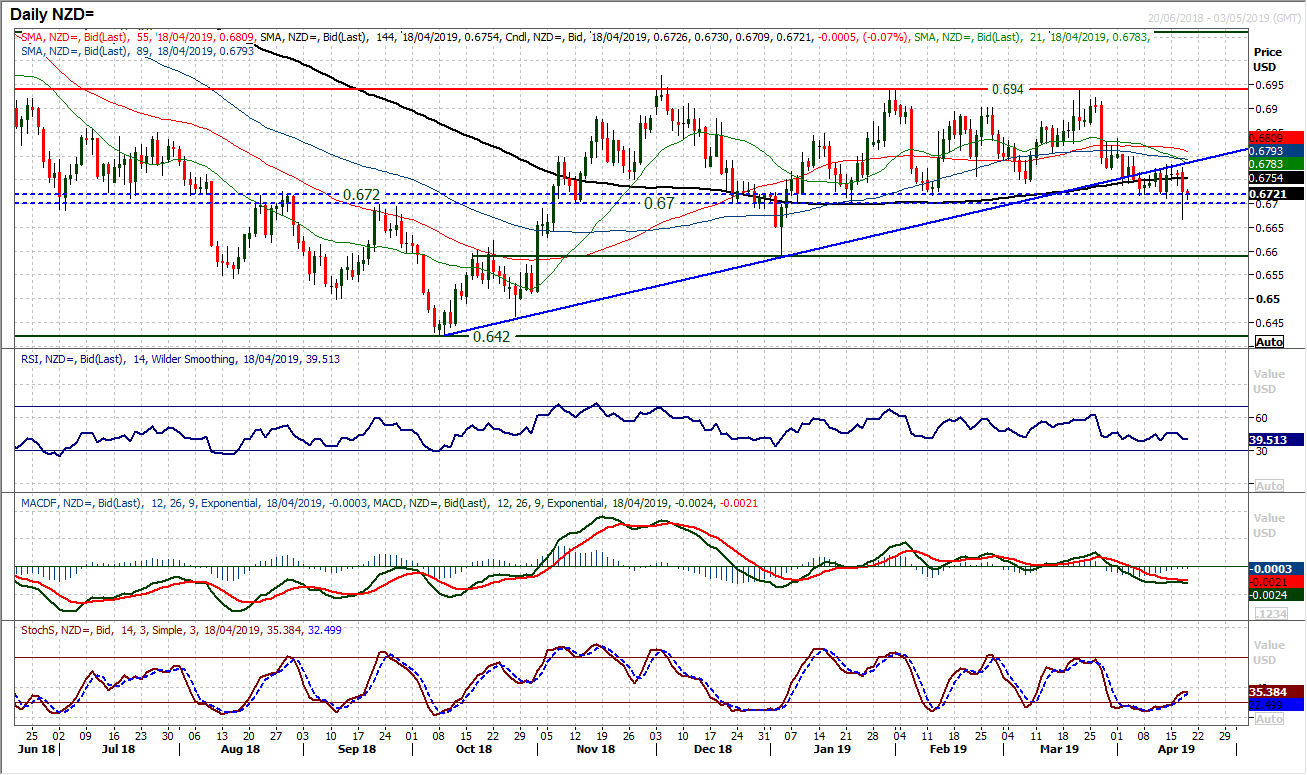
As the Aussie continues to outperform, the Kiwi is a struggle. Yesterday’s weak New Zealand inflation numbers piled on the pressure (see the hourly chart spike) and an intraday downside break to a three month low ensued. For months, there has been a basis of a pivot at $0.6700/$0.6720. Although the market rebounded into the close, the sharp intraday breach of support is a big warning shot for Kiwi bulls. A close below $0.6700 would be a confirmed downside break and open a move back towards $0.6590, the December low. Momentum indicators are on the brink, with the MACD lines set for a bear kiss lower below neutral. If the RSI moves into the mid/low 30s would be confirmation too. It is interesting to see the underside of the old uptrend is now a basis of resistance, whilst this week’s high at $0.6780 is increasing as resistance. This morning’s tick lower suggests pressure continues to build on $0.6700. The hourly chart shows initial resistance at $0.6745. The hourly RSI is also negatively configured to suggest that rallies are increasingly a chance to sell.
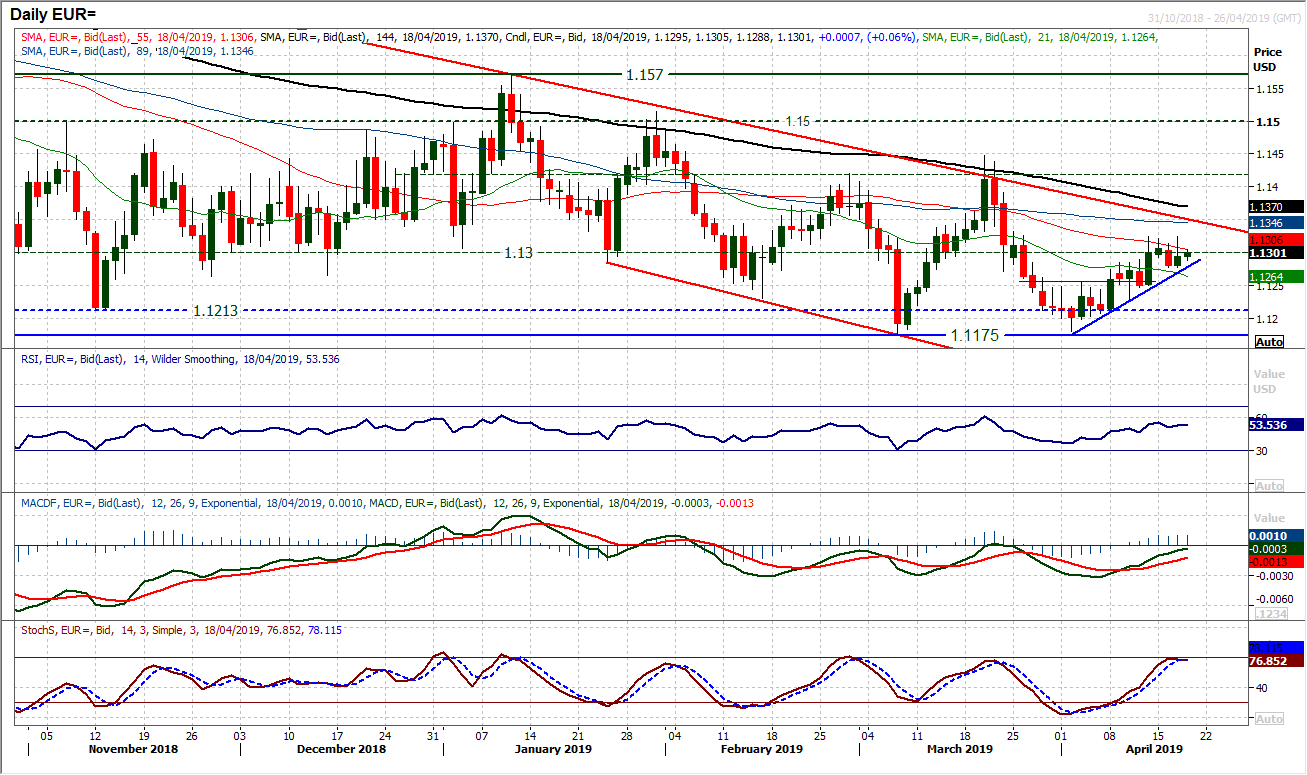
The uptrend of the past two weeks is still on course. However, it should be noted that the resistance of $1.1325 from last week is yet to be breached. It looked as though the bulls were ready yesterday, but resistance holds firm. This is just now beginning to drag a touch on momentum indicators, with the Stochastics tailing off whilst RSI is beginning to lose traction. Can this uptrend continue? This could be a key moment for EUR/USD. Over previous months there have been moves in cycles of around two to three weeks. Uptrends follow downtrends. The hourly chart shows the trend higher remains on course for now, with hourly RSI holding up above 40. However, the support around $1.1280 needs to be watched, with a failure suggesting the bulls losing control. A move below $1.1250 would be a negative signal now.
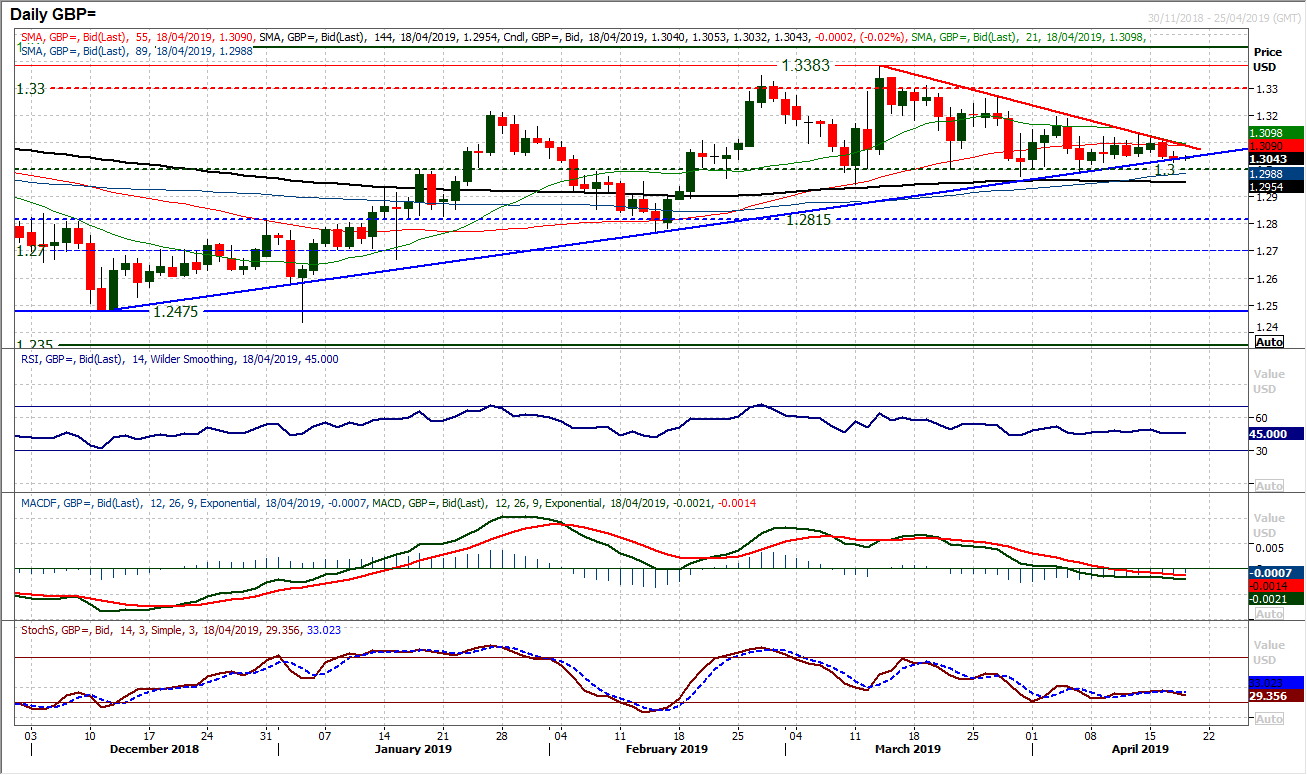
The consolidation on Cable continues. The convergence of the trend lines is now at an extent where there will surely be a breach today. The five week downtrend and four month uptrend are now just 45 pips apart. However, this is a trend breach on consolidation and there is little real suggestion that any direction will ensue. There is a mild negative bias following the slight bear candles of this week. However $1.3000 is a key floor of support which has held for two months. Resistance at $1.3130 is also now building and given the trend of lower highs, could become another. Daily momentum has a slight bear bias on both daily and hurly charts now. Initial support at $1.3030 is holding though. Initial resistance at $1.3070 from yesterday’s high.
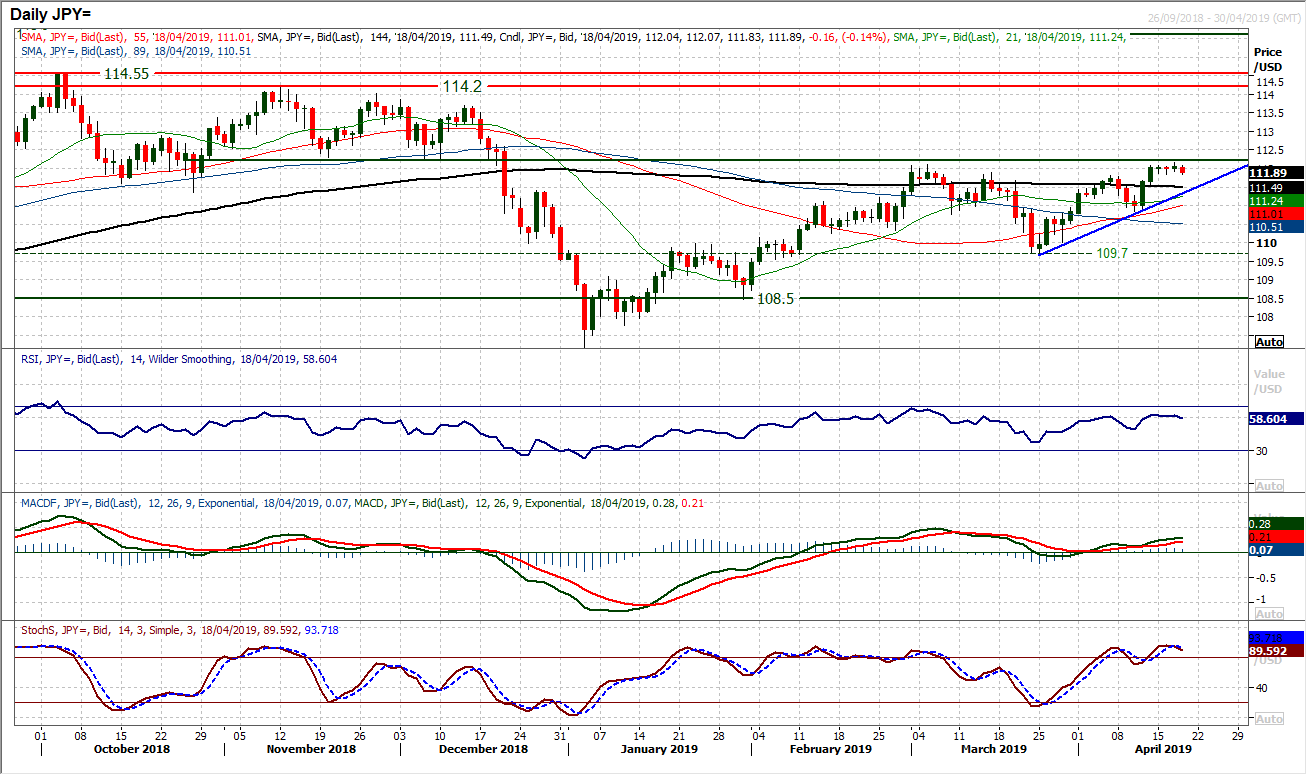
The medium term resistance is holding firm. The overhead supply of the November/December lows 112.20/112.30 and the February high of 112.10 has prevented the run higher from continuing. Moves throughout this week have been very slight and lacking any conviction for the break. Traders come into today’s session with a slight pull lower which is beginning to drag on the daily Stochastics. However, looking on the hourly chart, this is still just playing out as a consolidation above 111.80 breakout support. There is still a feeling that 111.60/111.80 is a near term buy zone. Furthermore, the daily chart shows a near four week uptrend at 111.30 now. The bulls would essentially retain control whilst the support at 110.80 is intact.
Gold
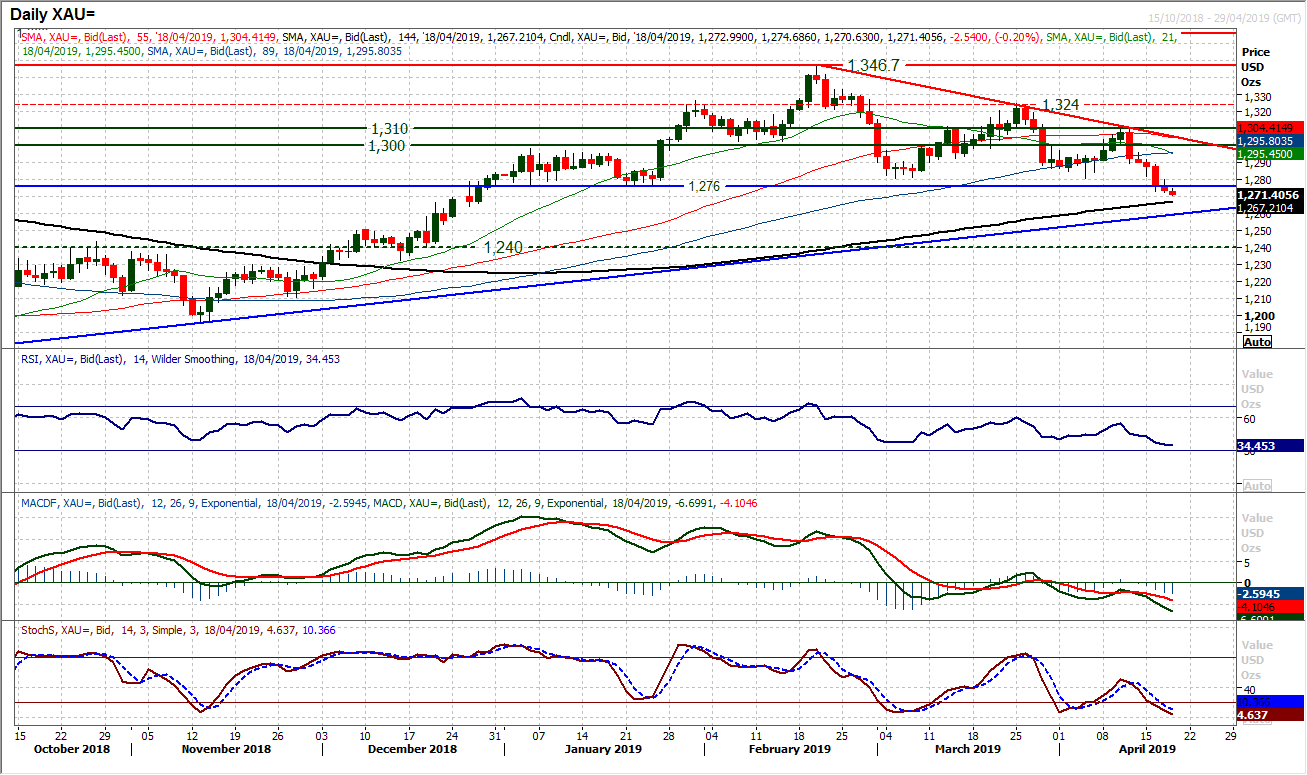
Often when there is a strong move, the next session can see a retracement. The concern is that for much of yesterday’s session, gold was trying for a recovery, but there was little appetite to buy. A close below $1276 is a key downside break. It now means that the old key support band $1276/$1280 is a basis of resistance. Yesterday’s close below $1276 has confirmed what looks to be an increasingly negative outlook on gold. Such is the importance of the breakdown, a second closing breach of $1276 would confirm the bears being in control. A head and shoulders top pattern implies $70 of additional downside in the coming months. This means a retreat towards $1206 could be seen in the coming months. The outlook is increasingly negative now, with the support of the eight month uptrend at $1259 and the 144 day moving average (at $1273) being the only positive technical signals. The next real support is not until an old pivot around $1240. The hourly chart shows resistance is at $1280 initially and a pivot at $1290. This all comes under the long term pivot band $1300/$1310 which is increasingly key resistance.
WTI Oil
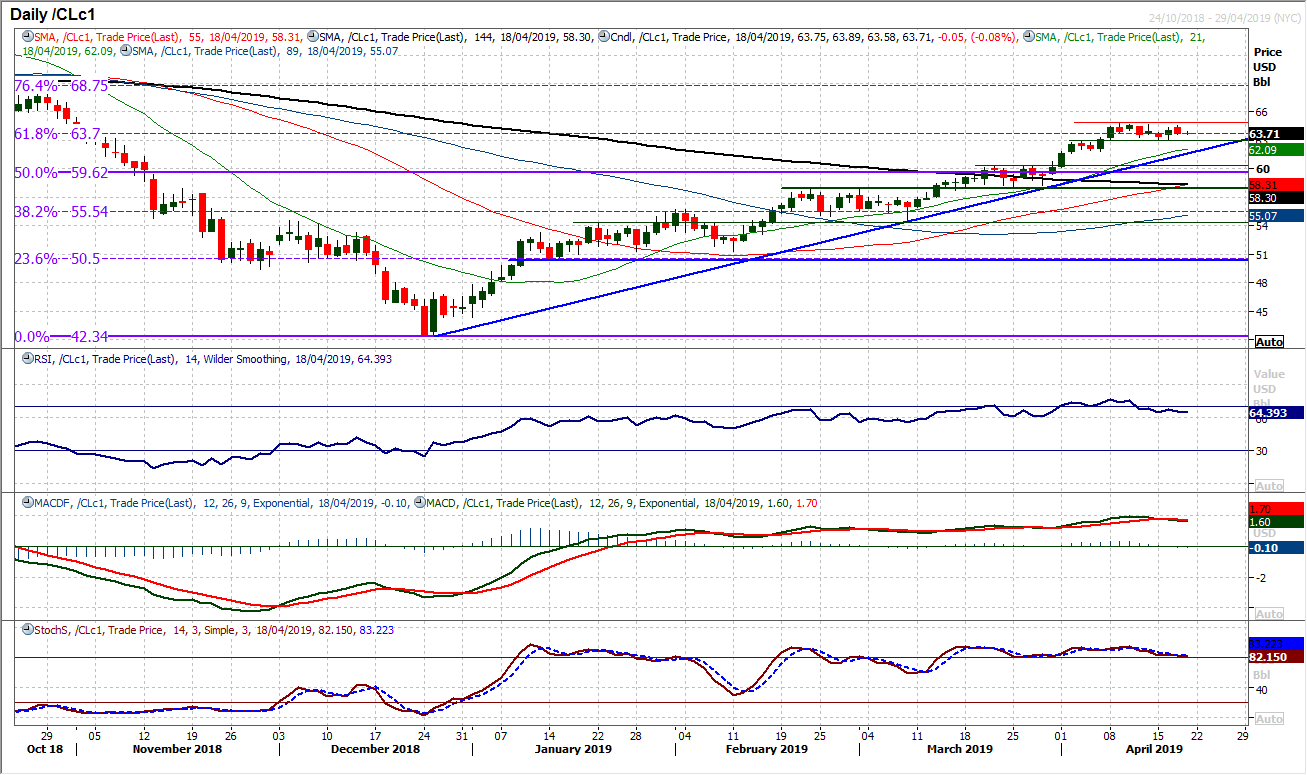
Although Brent Crude has been breaking to new multi-month highs, WTI is yet to follow suit. Despite an initial look at the resistance at $64.80, WTI fell away. Subsequently, a slight fall into the close was seen yesterday as WTI continues to trade in the mini range $$63.00/$64.80. Although the bulls will have been disappointed by the inability to breakout, this is still likely to be a near term blip before the next upside break. Momentum indicators remain positively configured and any weakness is a chance to buy. A closing breakout above $64.80 implies $66.60. Furthermore, the medium term implication would be a move to the 76.4% Fibonacci retracement at $68.75 in due course. Losing support at $63.00 would be disappointing now, but whilst the support at $61.80 remains intact along with the rising 21 day moving average (c. $62.10) and near four month uptrend (c. 61.60), the bulls will be confident.
Dow Jones Industrial Average
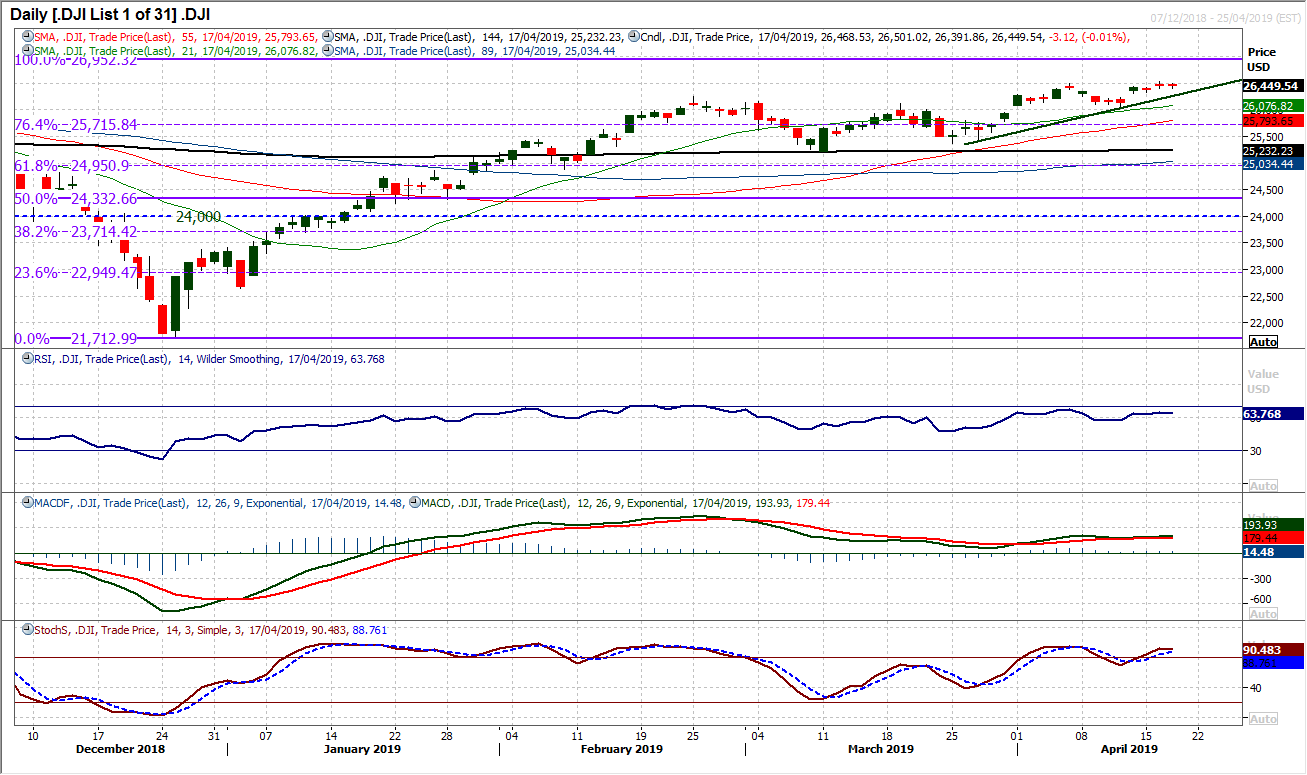
Another session of caution on Wall Street as Easter approaches. The Dow closed just 3 ticks lower as a consolidation continues. There is very little that can really be taken from the session yesterday, although the failure to kick on from a move above 26,488 will be slightly irksome to some traders. A trend higher of the past few weeks is supportive around 26,315 today, whilst momentum indicators remain positive. Weakness is still a chance to buy and it remains the preferred outlook for the bulls move to continue higher. A test of the all-time high at 26,952 remains likely. Initial support at this week’s low at 26,315 with 26,062 key near term.
Note: All information on this page is subject to change. The use of this website constitutes acceptance of our user agreement. Please read our privacy policy and legal disclaimer. Opinions expressed at FXstreet.com are those of the individual authors and do not necessarily represent the opinion of FXstreet.com or its management. Risk Disclosure: Trading foreign exchange on margin carries a high level of risk, and may not be suitable for all investors. The high degree of leverage can work against you as well as for you. Before deciding to invest in foreign exchange you should carefully consider your investment objectives, level of experience, and risk appetite. The possibility exists that you could sustain a loss of some or all of your initial investment and therefore you should not invest money that you cannot afford to lose. You should be aware of all the risks associated with foreign exchange trading, and seek advice from an independent financial advisor if you have any doubts.
Recommended Content
Editors’ Picks
EUR/USD rises toward 1.0700 after Germany and EU PMI data

EUR/USD gains traction and rises toward 1.0700 in the European session on Monday. HCOB Composite PMI data from Germany and the Eurozone came in better than expected, providing a boost to the Euro. Focus shifts US PMI readings.
GBP/USD holds above 1.2350 after UK PMIs

GBP/USD clings to modest daily gains above 1.2350 in the European session on Tuesday. The data from the UK showed that the private sector continued to grow at an accelerating pace in April, helping Pound Sterling gather strength.
Gold price flirts with $2,300 amid receding safe-haven demand, reduced Fed rate cut bets

Gold price (XAU/USD) remains under heavy selling pressure for the second straight day on Tuesday and languishes near its lowest level in over two weeks, around the $2,300 mark heading into the European session.
Here’s why Ondo price hit new ATH amid bearish market outlook Premium

Ondo price shows no signs of slowing down after setting up an all-time high (ATH) at $1.05 on March 31. This development is likely to be followed by a correction and ATH but not necessarily in that order.
US S&P Global PMIs Preview: Economic expansion set to keep momentum in April

S&P Global Manufacturing PMI and Services PMI are both expected to come in at 52 in April’s flash estimate, highlighting an ongoing expansion in the private sector’s economic activity.