![]() Dr. Nektarios Michail
Dr. Nektarios Michail
HotForex
Most economic data releases provide a view of how the economy fared in the recent past. GDP, for example, tells us how the economy did in the previous quarter while CPI shows how prices evolved in the previous month. Even if the release is close to the end of the previous month, like the NFP data release, the data still paints an image of the past, akin to driving by looking just at the rear view mirrors to gauge what’s coming ahead.
Leading indicators, on the other hand, aim to do the opposite. In essence, these indicators aim to provide an overview of how the economy will fare in the future, and are mostly qualitative in nature, i.e. they focus mostly on surveys regarding sentiment and perceptions regarding the month or months to come. This has both its benefits and its disadvantages. To begin with the positive, given that many businesspeople usually observe or experience a change in the market environment before this actually takes place in the data, such indicators are usually very good in predicting turning points, from recession to growth and vice versa. On the other hand, leading indicators may not be quite clear as to whether a 2% or a 1% economic growth is to be observed, given that various sectors can experience different demand for their goods and services.
The remainder of this article provides a broad overview of the most popular leading indicators.
PMIs
As explained in an earlier post, PMIs are important as they provide the purchasing managers’ views on how much they have experienced a market improvement, stabilisation or deterioration in the past month. PMIs are probably the most important leading indicators and, as such, have a full article explaining how they impact the FX and stock market.
Sentiment Indices
Consumer Sentiment indices aim at capturing how consumers feel about the state of the economy, focusing mostly on how they perceive the economic situation in the coming years. For example, the University of Michigan Consumer Sentiment Index asks respondents how they perceive that business conditions, the respondent’s personal finances, and the economy as a whole will evolve in the coming twelve months. Despite its relative simplicity, the University of Michigan Consumer Sentiment Index actually has a strong positive effect on the Dollar, as the graph below indicates, where a better than expected Index result pushed the Dollar higher.
Confidence Indices
Confidence indices provide more or less the same information that sentiment indices provide. In essence, they provide a gauge of the degree of optimism that consumers feel about the overall state of the economy and, in some cases, their own financial situation. Examples of such indices can be found in many countries, such as Australia (Westpac Consumer Confidence), the US (Conference Board Consumer Confidence) and the UK (Gfk Consumer Confidence). On a similar note, New Zealand (NZIER Business Confidence) and Australia (National Australia Bank Business Confidence) provide business confidence indices which can, many times, capture the underlying workings of the economy better than consumer ones. The European Commission also produces a Consumer and Business Sentiment Index for each Euro Area country as well as an aggregate index.
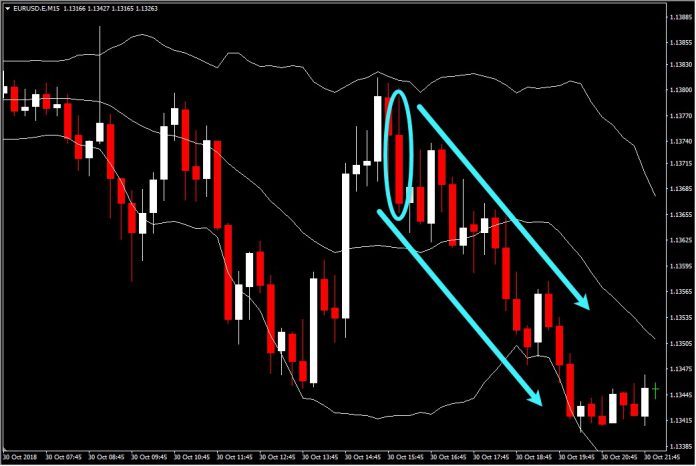
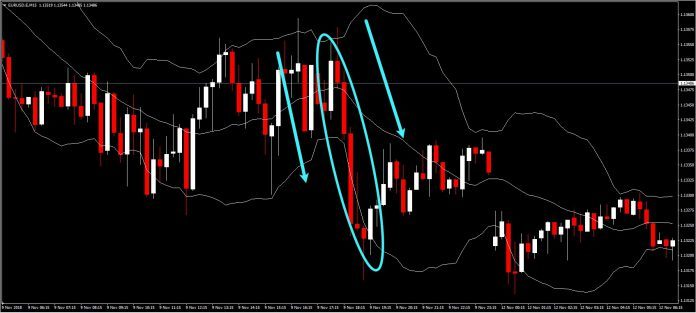
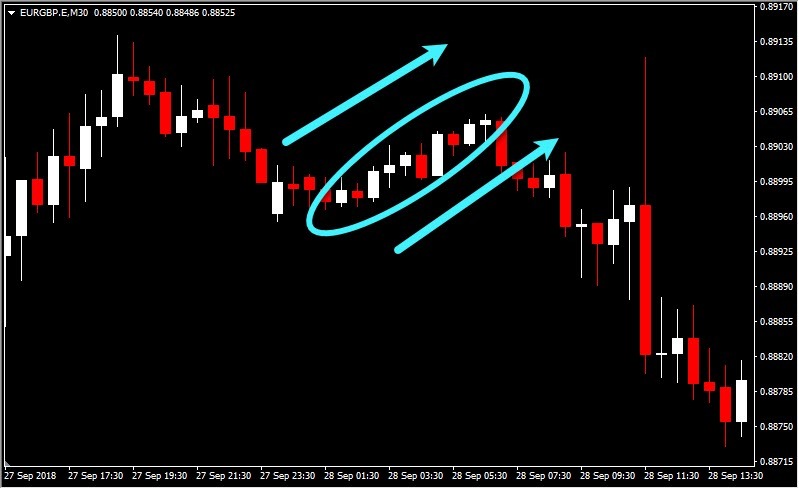
The following graph shows the effect UK consumer sentiment had on Sterling. On September 27, 2018, Gfk Consumer Confidence came out at -9, compared to expectations of -8, signifying a worsening of consumer perceptions, given that any number below zero suggests weakening confidence. In response to this, a 10-pip depreciative movement was registered over the next few hours. Similarly, a US Conference Board Consumer Confidence reading (at the top of this post) which was better than expected, led to a 15-pip reaction in just 15 minutes after the announcement, while the whole of the movement was more than 40 pips.
Philly Fed and Empire State Manufacturing Index
These US-specific indices, published by the Federal Reserve Banks of Philadelphia and New York, are a leading indicator of economic conditions, constructed by surveying manufacturers in the Philadelphia and New York districts. Similar to most of the indices above, a reading below 0 suggests the worsening of economic conditions. Both the Philly Fed and the Empire State Indices are almost always released at the same time as other important data releases such as jobless claims and retail sales, and thus their effect on the currency and stock markets cannot be accurately gauged. On the other hand, given that both are leading indicators they serve more for providing the future overview of the US economy and offer a longer-term view on the market instead ofbeing reliable for just short-term trading.
Coincident and Leading Economic Indices
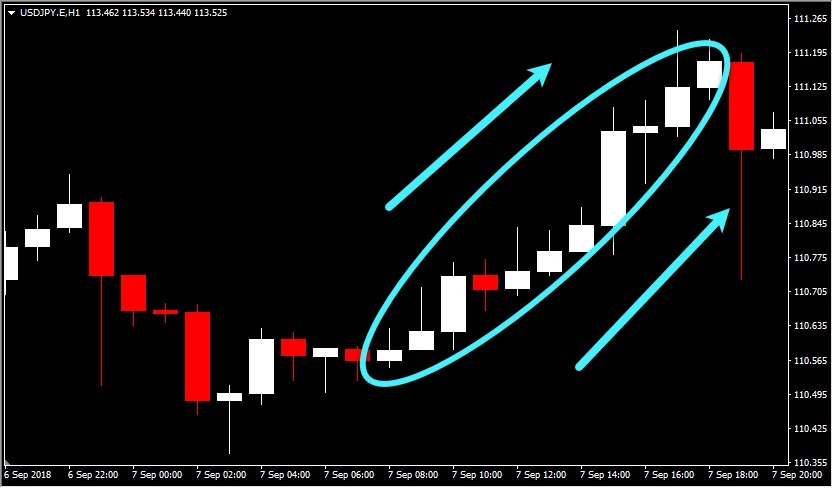
The Japanese version of confidence indicators comprises of the Leading Economic Index which itself consists of 12 other indicators such as inventory ratios, machinery orders, stock prices, and others. In addition, Japan also publishes the Coincident Index which measures the current state of the economy, albeit with a shorter lag compared to other coincidental indices such as GDP or personal income. The Coincident Index reading is similar to the PMI indices where a reading above 50 signifies expansion while a reading below 50 signifies contraction. A worse than expected result on September 7, 2018 led to a 66-pip depreciation of the Yen over the trading day, of which an 8-pip movement was observed in the first hour after the announcement.
Naturally, the list is not exhaustive. New jobless claims can also serve as leading indicators, and the same with building permits for the housing sector as well as the banking sector and money supply data for the economy. The first two have been elaborated upon here and here, while for the last one, a post will come up soon.
Disclaimer: Nothing in this communication contains, or should be considered as containing, an investment advice or an investment recommendation or a solicitation for the purpose of purchase or sale of any financial instrument.
Recommended Content
Editors’ Picks
EUR/USD holds above 1.0650 after US data

EUR/USD retreats from session highs but manages to hold above 1.0650 in the early American session. Upbeat macroeconomic data releases from the US helps the US Dollar find a foothold and limits the pair's upside.
GBP/USD retreats toward 1.2450 on modest USD rebound

GBP/USD edges lower in the second half of the day and trades at around 1.2450. Better-than-expected Jobless Claims and Philadelphia Fed Manufacturing Index data from the US provides a support to the USD and forces the pair to stay on the back foot.
Gold clings to strong daily gains above $2,380

Gold trades in positive territory above $2,380 on Thursday. Although the benchmark 10-year US Treasury bond yield holds steady following upbeat US data, XAU/USD continues to stretch higher on growing fears over a deepening conflict in the Middle East.
Ripple faces significant correction as former SEC litigator says lawsuit could make it to Supreme Court

Ripple (XRP) price hovers below the key $0.50 level on Thursday after failing at another attempt to break and close above the resistance for the fourth day in a row.
Have we seen the extent of the Fed rate repricing?

Markets have been mostly consolidating recent moves into Thursday. We’ve seen some profit taking on Dollar longs and renewed demand for US equities into the dip. Whether or not this holds up is a completely different story.