![]() Carley Garner
Carley Garner
DeCarley Trading
Event risk is looming in the financial markets.
On a scale of 1 to 10 this week's calendar event risk is a 12. We will be hearing about home data, employment data, manufacturing data, and sentiment data all while attempting to digest a mid-week Fed meeting (did I mention the State of the Union Address?). Economic data has been consistently strong; it doesn't make sense to expect otherwise. Yet, the financial markets have reacted to both good and bad data in the same manner (buy stocks, sell bonds, sell the dollar, etc.). If there is anything that could change that pattern, it would be a good old-fashioned price squeeze. Big events such as Fed meetings and payroll reports are often the catalyst for such last hurrah trend extensions followed by eventual reversals. This week feels like it is setting up to be one of those times.
Treasury Futures Markets
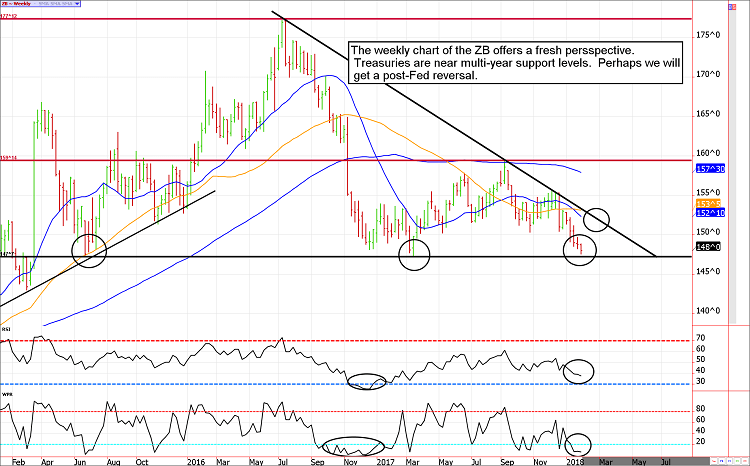
Treasuries are likely in store for one more round of long-squeezing before turning the corner.
Despite relatively high yields and low default risk, Treasuries haven't been able to find buyers. In the short-run this makes sense; investors are chasing momentum not yield. However, in the long-run higher-yielding Treasuries will lure money away from the equity markets.
With stocks, bonds, and currencies at extremes and with speculators so heavily loaded in directional trend trades, we have a feeling the exhaustion of these moves is looming. Further, the inflection point could be on the heels of either the Fed meeting on Wednesday or the payroll report on Friday.
If you are a bond bull, look to try to get in on a dip into the 147/146 range in the ZB and the mid-to-low-121s in the 10-year note.
Treasury Futures Market Analysis
**Bond Futures Market Consensus:** Treasuries were weaker than we originally anticipated. However, the bulls should get a good opportunity on one more probing low (146/147 in the 30-year).
**Technical Support:** ZB : 147'31, 147'18, 147'0, and 146'12 ZN: 121'17 and 121'01
**Technical Resistance:** ZB: 150'09 151'03 and 154'08 ZN: 123'05, 124'10 and 126'20
Stock Index Futures Markets
Euphoria is in the air, will it ever clear?
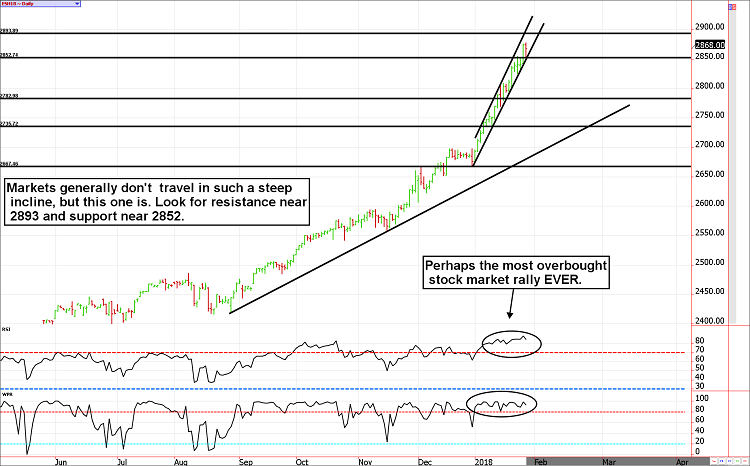
This market has thrown sentiment contrarian indicators and technical oscillators out the window. The only thing driving prices is emotion and FOMO (Fear of Missing Out). Most oscillators applied to a chart of any time frame (monthly, weekly, daily) suggest this is the most overbought the stock market has been in decades, or possibly even ever. As we have all been reminded, overbought doesn't necessarily mean there will be sellers. Afterall, buying is FOMO driven...not price driven, nor does it have to be logical.
The chart suggests the next up-move should run into resistance near 2893. Based on previous rallies going into a Fed meeting, we believe there is a good chance of this price being seen by the end of the week (we aren't necessarily bullish, we are just identifying the pattern). If this price is seen, it might be a place for the bears to give the downside a shot (assuming there are any left with the funds to play).
On the flip side, if prices break below 2852 the bears might finally get some relief.
Stock Index Futures Market Ideas
**E-mini S&P Futures Market Consensus:**
Technical oscillators on all time-frames have been perpetually overbought. How long can this last?
**Technical Support:** 2852, 2873, 2735, and 2667
**Technical Resistance:** 2893 and 2902
E-mini S&P Futures Day Trading Ideas
**These are counter-trend entry ideas, the more distant the level the more reliable but the less likely to get filled**
ES Day Trade Sell Levels: 2881, 2887, and 2893
ES Day Trade Buy Levels: 2856, 2829, 2801, and 2790
In other commodity futures and options markets....
November 1 - Bull call spread with a naked leg in May corn (buy the May 3.70 call, sell the 4.00 call and the 3.50 put). The cost of the trade is 3 to 4 cents, the risk is open under 3.50, the profit potential is roughly 26 cents or $1,300.
December 12 - Buy back 4.00 corn call to lock in small gain and open the trade to upside profits if the market reverses.
January 22 - Buy March 10-year note 123 calls for about 17 ticks.
January 25 - Buy March crude oil 62.50 put near 28 cents.
Due to time constraints and our fiduciary duty to put clients first, the charts provided in this newsletter may not reflect the current session data.
Seasonality is already factored into current prices, any references to such does not indicate future market action.
**There is substantial risk of loss in trading futures and options.** These recommendations are a solicitation for entering into derivatives transactions. All known news and events have already been factored into the price of the underlying derivatives discussed. From time to time persons affiliated with Zaner, or its associated companies, may have positions in recommended and other derivatives. Past performance is not indicative of future results. The information and data in this report were obtained from sources considered reliable. Their accuracy or completeness is not guaranteed. Any decision to purchase or sell as a result of the opinions expressed in this report will be the full responsibility of the person authorizing such transaction. Seasonal tendencies are a composite of some of the more consistent commodity futures seasonals that have occurred over the past 15 or more years. There are usually underlying, fundamental circumstances that occur annually that tend to cause the futures markets to react in similar directional manner during a certain calendar year. While seasonal trends may potentially impact supply and demand in certain commodities, seasonal aspects of supply and demand have been factored into futures & options market pricing. Even if a seasonal tendency occurs in the future, it may not result in a profitable transaction as fees and the timing of the entry and liquidation may impact on the results. No representation is being made that any account has in the past, or will in the future, achieve profits using these recommendations. No representation is being made that price patterns will recur in the future.
Due to the volatile nature of the futures markets some information and charts in this report may not be timely. There is substantial risk of loss in trading futures and options. Past performance is not indicative of future results. The information and data in this report were obtained from sources considered reliable. Their accuracy or completeness is not guaranteed and the giving of the same is not to be deemed as an offer or solicitation on our part with respect to the sale or purchase of any securities or commodities. Any decision to purchase or sell as a result of the opinions expressed in this report will be the full responsibility of the person authorizing such transaction.
Recommended Content
Editors’ Picks
AUD/USD remained bid above 0.6500

AUD/USD extended further its bullish performance, advancing for the fourth session in a row on Thursday, although a sustainable breakout of the key 200-day SMA at 0.6526 still remain elusive.
EUR/USD faces a minor resistance near at 1.0750

EUR/USD quickly left behind Wednesday’s small downtick and resumed its uptrend north of 1.0700 the figure, always on the back of the persistent sell-off in the US Dollar ahead of key PCE data on Friday.
Gold holds around $2,330 after dismal US data

Gold fell below $2,320 in the early American session as US yields shot higher after the data showed a significant increase in the US GDP price deflator in Q1. With safe-haven flows dominating the markets, however, XAU/USD reversed its direction and rose above $2,340.
Bitcoin price continues to get rejected from $65K resistance as SEC delays decision on spot BTC ETF options

Bitcoin (BTC) price has markets in disarray, provoking a broader market crash as it slumped to the $62,000 range on Thursday. Meanwhile, reverberations from spot BTC exchange-traded funds (ETFs) continue to influence the market.
US economy: slower growth with stronger inflation

The dollar strengthened, and stocks fell after statistical data from the US. The focus was on the preliminary estimate of GDP for the first quarter. Annualised quarterly growth came in at just 1.6%, down from the 2.5% and 3.4% previously forecast.