![]() Andre Gratian
Andre Gratian
Market Turning Points
Market Overview
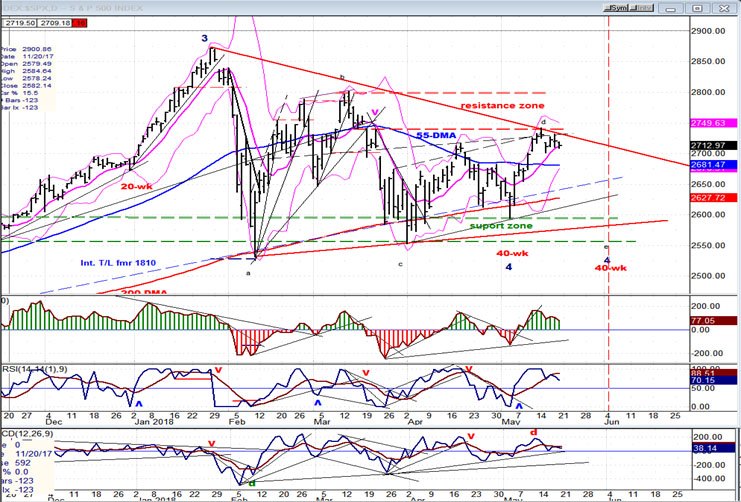
Ever since the beginning of the correction, I thought that it might not be over until the 40-week cycle had bottomed. Of course, I did not know how exactly this would end. As of now, it looks as if it will be with the completion of a symmetrical triangle, but this is only an assumption which remains to be proven correct. The low should still be ahead of usbut, as I mentioned in the last letter, there is an outside chance that this intermediate cycle might have made its low on 5/03, at 2554. If so, that date will turn out to be that of the final e-wave of the triangle. The alternative is that we have just now started the final leg of that formation.
I had originally estimated the low to be on 5/21, but later felt that a better fit would be the beginning of June. Minor cycles call for a low either Monday or Tuesday. If the rebound from that low is muted, we should continue to have another week or so of price weakness before a new uptrend can get under way. Let’s see how it plays out!
Chart Analysis (These charts and subsequent ones courtesy of QCharts)
SPX daily chart
The rally from 2595 peaked on Monday and the index started a pull-back which was fast and steep. This was followed by a two-day rebound which fell 10 points short of Monday’s high and gave up 50% of its daily range by the close. Friday was another down day, which had been anticipated because a minor cycle was bottoming on that day. Because another, slightly longer, minor cycle is due early next week, we waited to see how much of a rally Friday would bring! It was only a one-hour affairand the index drifted for the rest of the session.
This action almost ensures more weakness early in the week. If so, and we drop below 2700, we could see a 20-pt drop before finding support. Assuming that we get down to about 2680, this would be an approximate .382 retracement of the rally from 2595, and it would also find support at the blue 55-DMA. That would constitute a perfectly normal correction of that rally, and if we see some good strength returning to the market after this, there is a good chance that the correction did end on 5/03. For the 40-wk cycle to still push ahead to early June, we would need to see another weak rebound, followed by more weakness by the end of the week.
The daily indicators turned down last week, suggesting that more corrective action should continue into next week, but they are still positive. Only if they turn negative will they suggest that the correction could continue for a while longer.
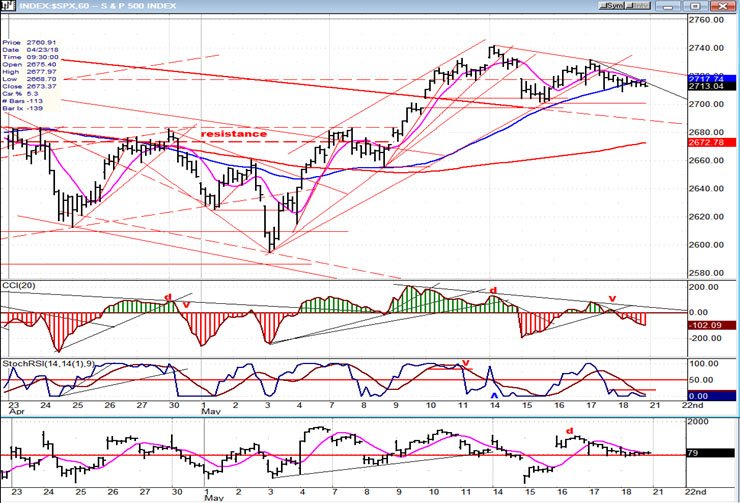
SPX hourly chart
Thursday and Friday did not bring that much weakness to the correction from 2595 – as we can plainly see in the A/Ds (bottom oscillator) which remained essentially positive -- but it was enough to generate a sell signal in the momentum indicators which remained in effect until the close.
We are at the point where we need to keep track of the market action on a daily basis to determine how the market will end its correction, but let’s keep in mind that if the ideal time frame is observed, we still have about two weeks of potential twists and turns before we can reverse the intermediate trend. Next week and the following one should bring more clarification in order to be crystal clear.
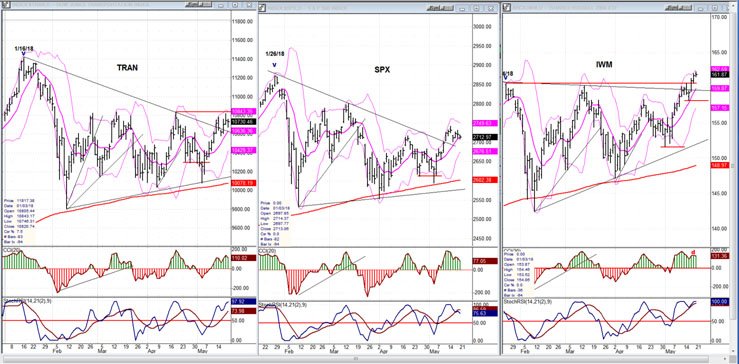
SPX, IWM, TRAN (daily charts)
IWM is taking its function of leading indicator seriously! It has already made an all-time high. But in the process, it has become overextended,has developed some negative divergence in the CCI,and may have filled a short-term P&F projection. This is suggestive of an imminent pull-back. Besides, the TRAN is telling it: “cool it! I’m not ready.”
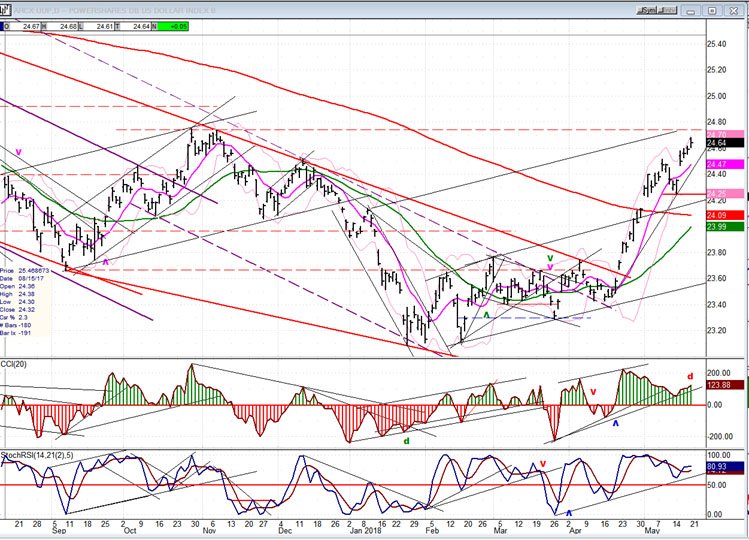
UUP (dollar ETF) Weekly
UUP may have completed its move from late March. A structure of 5 waves is visible, and the last wave is about the same length as the first. Furthermore, negative divergence is showing in the indicators. This is consistent with the end of a short-term trend and, if correct, should bring a price reversal imminently.
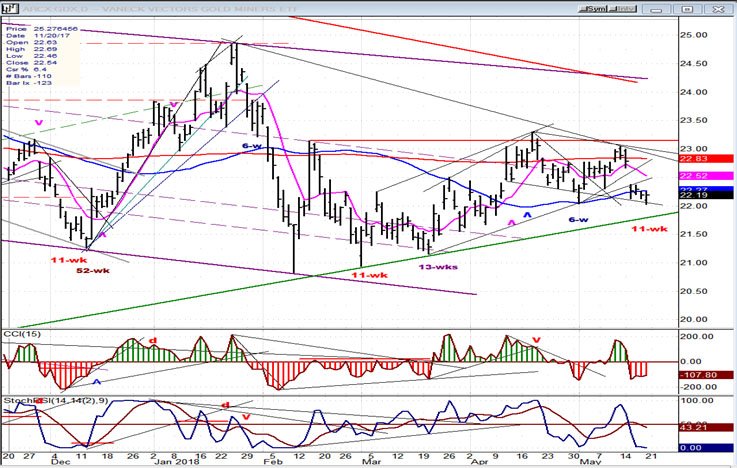
GDX (Gold miners ETF)
There is good evidence that GDX has made an 11-wk cycle low (if not on Friday, then any day now). Since GDX and UUP have formed synchronized countertrends lately, the above analysis of UUP would appear to confirm that of GDX. If so, GDX is ready to rally, but this will be limited by the 26-wk cycle low which is due in about three weeks.
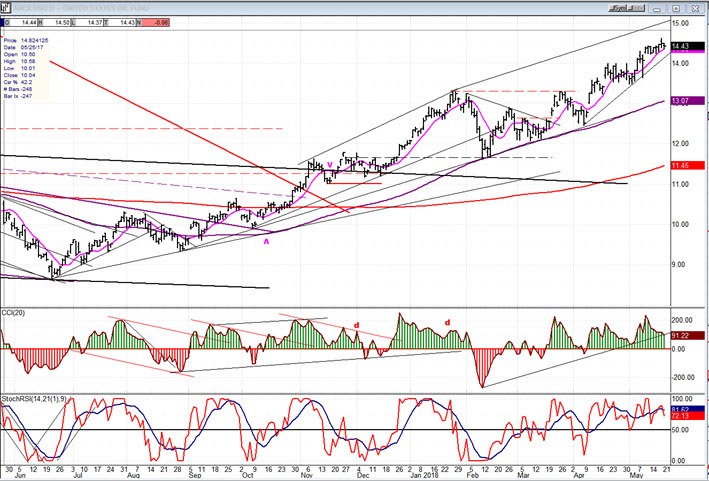
USO (United States Oil Fund)
USO has now met its near-term target of 14.50-1500. Although it could still push just a little higher, the negative divergence which is appearing in the indicators warns us that the beginning of a correction is near.
Summary
We are about to find out if the low of the 40-week cycle, which has been estimated to be in about two weeks, is accurate. For this to be correct, we will need to see additional weakness directly ahead. A near-term resumption of the rally which started at 2595 would nullify this analysis.
The comments made in the daily updates and the Market Summary about the financial markets are based purely on what I consider to be sound technical analysis principles. They represent my own opinion and are not meant to be construed as trading or investment advice, but are offered as an analytical point of view which might be of interest to those who follow stock market cycles and technical analysis.
Recommended Content
Editors’ Picks
AUD/USD posts gain, yet dive below 0.6500 amid Aussie CPI, ahead of US GDP

The Aussie Dollar finished Wednesday’s session with decent gains of 0.15% against the US Dollar, yet it retreated from weekly highs of 0.6529, which it hit after a hotter-than-expected inflation report. As the Asian session begins, the AUD/USD trades around 0.6495.
USD/JPY finds its highest bids since 1990, approaches 156.00

USD/JPY broke into its highest chart territory since June of 1990 on Wednesday, peaking near 155.40 for the first time in 34 years as the Japanese Yen continues to tumble across the broad FX market.
Gold stays firm amid higher US yields as traders await US GDP data

Gold recovers from recent losses, buoyed by market interest despite a stronger US Dollar and higher US Treasury yields. De-escalation of Middle East tensions contributed to increased market stability, denting the appetite for Gold buying.
Ethereum suffers slight pullback, Hong Kong spot ETH ETFs to begin trading on April 30

Ethereum suffered a brief decline on Wednesday afternoon despite increased accumulation from whales. This follows Ethereum restaking protocol Renzo restaked ETH crashing from its 1:1 peg with ETH and increased activities surrounding spot Ethereum ETFs.
Dow Jones Industrial Average hesitates on Wednesday as markets wait for key US data

The DJIA stumbled on Wednesday, falling from recent highs near 38,550.00 as investors ease off of Tuesday’s risk appetite. The index recovered as US data continues to vex financial markets that remain overwhelmingly focused on rate cuts from the US Fed.