The euro appears to have carved out head and shoulders top. As this Great Graphic depicts, the euro was sold through the neckline at the end of last week and is 1% below it today. It is not unusual for the neckline to be retested. It is found near $1.15. It also dovetails with our near-term caution given that the euro is likely to close below its Bollinger Band for the second consecutive session (~$1.1440).
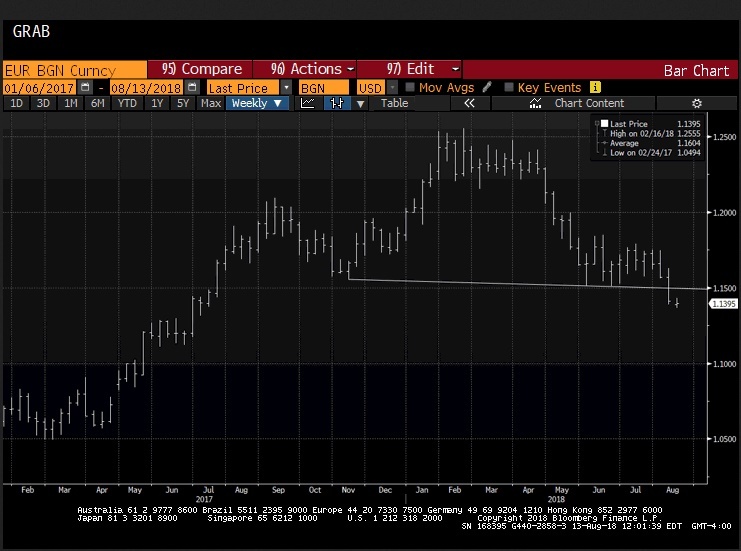
The left shoulder was formed last August and September with a peak near $1.21. Last November the euro had recorded a low by $1.1550 before rallying to a high of a little beyond $1.2550 by mid-February. The broad sideways trading until late April formed the head. The euro sold off in May and entered a new consolidative range through June and July. This formed what appears to be a right shoulder, even though it is not symmetric with the left shoulder. Still, the $1.1500 neckline offer support until the second half of last week, when the euro broke down.
The important attribute of technical patterns is the measuring objective. An initial target of a head and shoulders pattern can be estimated by rotating the pattern at the neckline. Specifically, the pattern is roughly ten cents--$1.15 to $1.25. Flipping it over provides a $1.05 objective. The euro spent a couple of weeks below there in late 2016 and early 2017, when it appeared to have forged a head and shoulder bottom. The euro has struggled to take out the neckline then until it was clear that the French were going to reject the National Front.
While the measuring objective may be clear, the timeframe is not. It took the smaller head and shoulders bottom the better part of three months to reach its measuring objective. The head and shoulders top we are discussing is roughly twice the size. There are a few support levels to monitor along the way. The $1.1300 area is the first, but also the weakest. A little below $1.12, the 61.8% retracement of the euro's rally (2017 through mid-Feb 2018) can be found. Next is a band of old congestion around $1.10.
Often the Dollar Index shows similar patterns as the euro. After all, the euro and currencies that move in the euro's orbit are the largest components. However, this time the head and shoulders bottom is not particularly clear. Yet if we squint the right way, the possible pattern would project toward 102, compared with the 103.80 high from early last year.
Opinions expressed are solely of the author’s, based on current market conditions, and are subject to change without notice. These opinions are not intended to predict or guarantee the future performance of any currencies or markets. This material is for informational purposes only and should not be construed as research or as investment, legal or tax advice, nor should it be considered information sufficient upon which to base an investment decision. Further, this communication should not be deemed as a recommendation to invest or not to invest in any country or to undertake any specific position or transaction in any currency. There are risks associated with foreign currency investing, including but not limited to the use of leverage, which may accelerate the velocity of potential losses. Foreign currencies are subject to rapid price fluctuations due to adverse political, social and economic developments. These risks are greater for currencies in emerging markets than for those in more developed countries. Foreign currency transactions may not be suitable for all investors, depending on their financial sophistication and investment objectives. You should seek the services of an appropriate professional in connection with such matters. The information contained herein has been obtained from sources believed to be reliable, but is not necessarily complete in its accuracy and cannot be guaranteed.
Recommended Content
Editors’ Picks
AUD/USD tumbles toward 0.6350 as Middle East war fears mount

AUD/USD has come under intense selling pressure and slides toward 0.6350, as risk-aversion intensifies following the news that Israel retaliated with missile strikes on a site in Iran. Fears of the Israel-Iran strife translating into a wider regional conflict are weighing on the higher-yielding Aussie Dollar.
USD/JPY breaches 154.00 as sell-off intensifies on Israel-Iran escalation

USD/JPY is trading below 154.00 after falling hard on confirmation of reports of an Israeli missile strike on Iran, implying that an open conflict is underway and could only spread into a wider Middle East war. Safe-haven Japanese Yen jumped, helped by BoJ Governor Ueda's comments.
Gold price jumps above $2,400 as MidEast escalation sparks flight to safety

Gold price has caught a fresh bid wave, jumping beyond $2,400 after Israel's retaliatory strikes on Iran sparked a global flight to safety mode and rushed flows into the ultimate safe-haven Gold. Risk assets are taking a big hit, as risk-aversion creeps into Asian trading on Friday.
Dogwifhat price pumps 5% ahead of possible Coinbase effect

Dogwifhat price recorded an uptick on Thursday, going as far as to outperform its peers in the meme coins space. Second only to Bonk Inu, WIF token’s show of strength was not just influenced by Bitcoin price reclaiming above $63,000.
Israel vs. Iran: Fear of escalation grips risk markets

Recent reports of an Israeli aerial bombardment targeting a key nuclear facility in central Isfahan have sparked a significant shift out of risk assets and into safe-haven investments.