![]() Clint Sorenson, CFA, CMT
Clint Sorenson, CFA, CMT
WealthShield
Highlights:
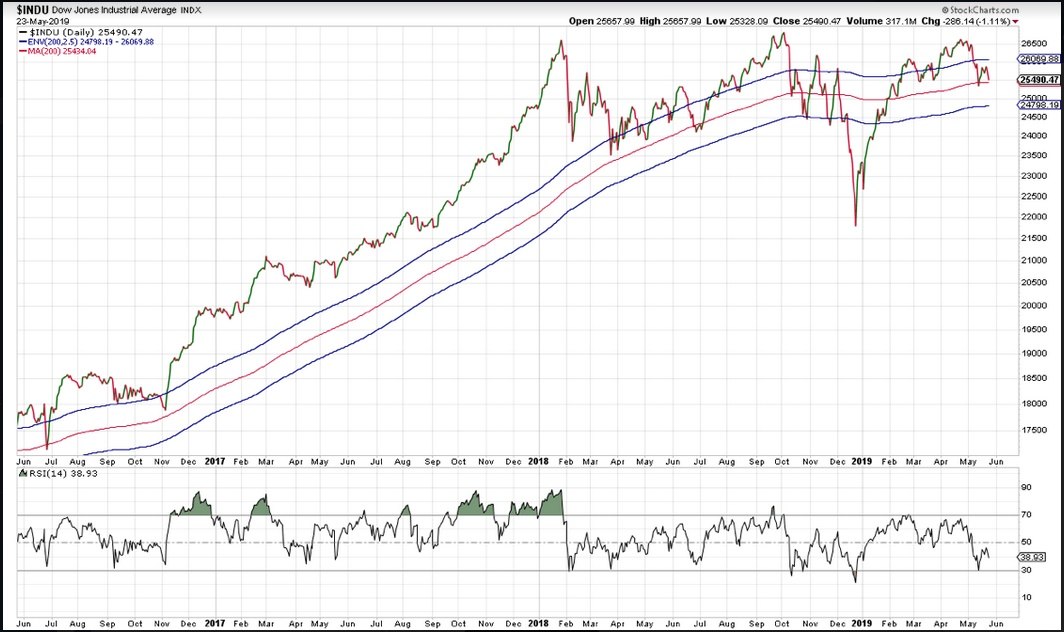
Market Recap: The VIX was up 14.71% yesterday, finishing at 16.92. Low volatility was the top factor and utilities were once again the top sector. Long-term Treasury bonds (TLT) were up 1.12% for the day. Gold was up 0.85% and the US dollar was down -0.16%. The S&P 500 finished down -1.19% and the Dow dropped -1.11%. The Dow was down -286 points and closed right above the 200 day moving average.
Chart of the Day: Is that a head and shoulders topping pattern on the Dow Jones Industrial Average within a longer term triple top?
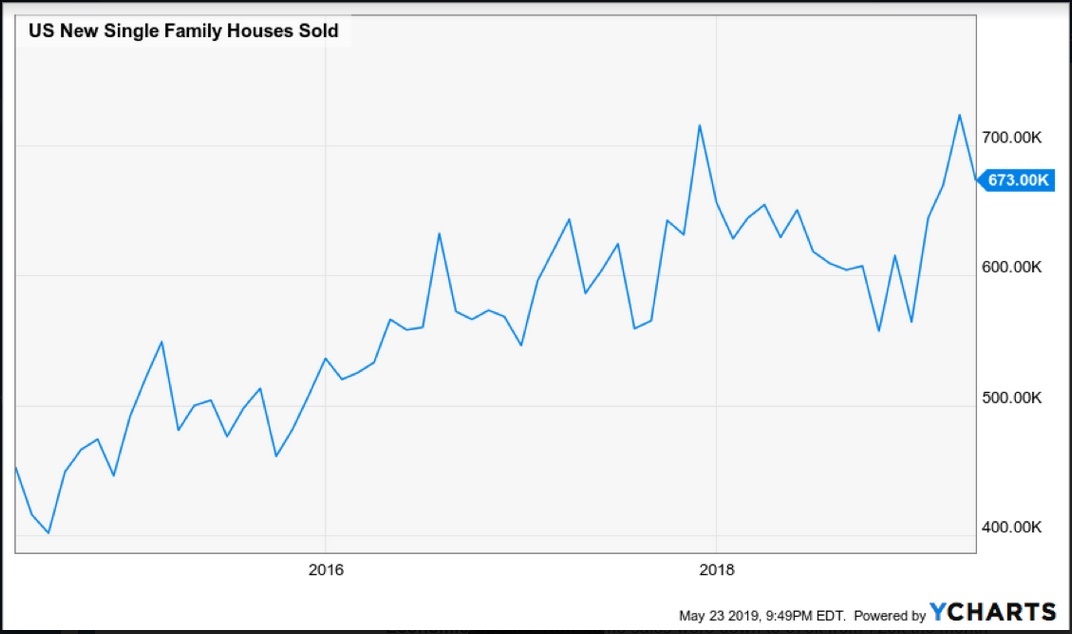
Economic Update: New home sales were down to 673k from 723k the month prior. That is a drop of almost 7% from the month prior.
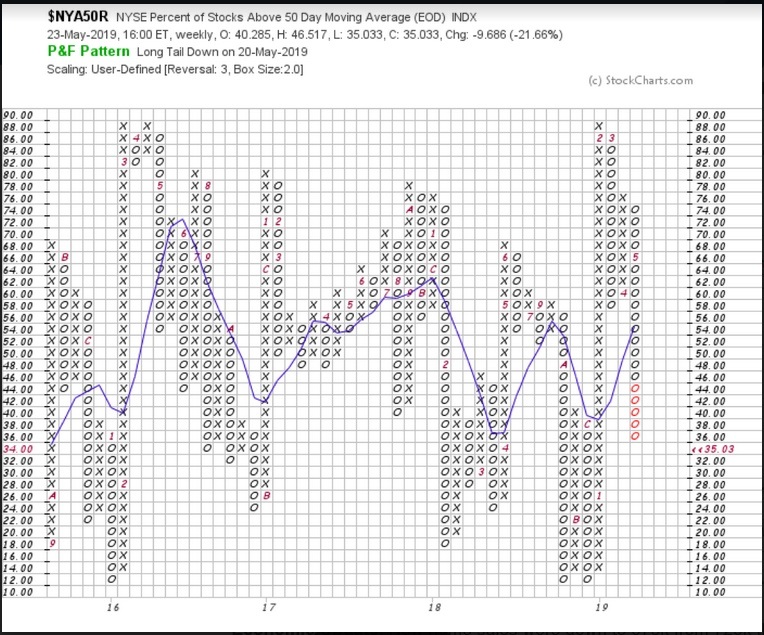
Short-term Market Internals: According to Investopedia, “The NYSE Composite Index is an index that measures the performance of all stocks listed on the New York Stock Exchange. The NYSE Composite Index includes more than 1,900 stocks, of which over 1,500 are U.S. companies. Its breadth therefore makes it a much better indicator of market performance than narrow indexes that have far fewer components. The weights of the index constituents are calculated on the basis of their free-float market capitalization. The index itself is calculated on the basis of price return and total return, which includes dividends.” To measure short-term market strength, we use the index that tracks the percentage of stocks that are above the 50 day moving average within the NYSE composite (NYA50R). On a point and figure chart, when it is in a column of o’s, it implies that the breadth is weakening. When the chart is in a column of x’s, it suggests that breadth is improving. Currently, the index is in a column of o’s and is not yet oversold. Breadth continues to weaken over the short-term.
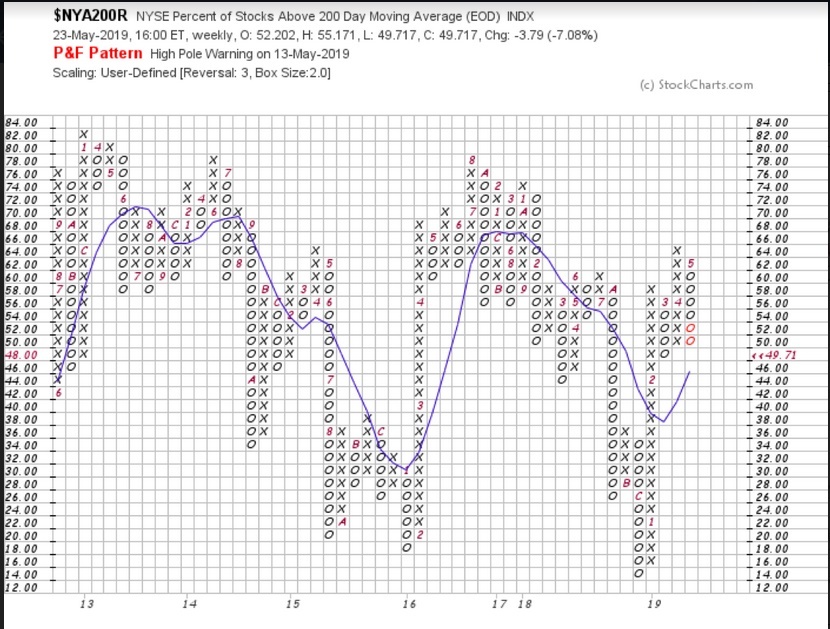
Intermediate Market Internals: Over the medium term we look at the index that tracks the percentage of stocks that are above the 200 day moving average (NYA200R). Currently, less than 50% of the issues in the NYSE are above their 200 day moving averages. The point and figure chart is also in a column of O’s after becoming overbought at around 64%.
Long-term Market Internals: The bullish percent index for the NYSE is a preferred method for measuring long-term market breadth. When the index is in a column of O’s, it has historically suggested that breadth was weakening. When the index is in a column of X’s, breadth is improving. Currently, 51% of the issues in the NYSE are on point and figure buy signals. The chart is in a column of o’s, implying weakening internals.
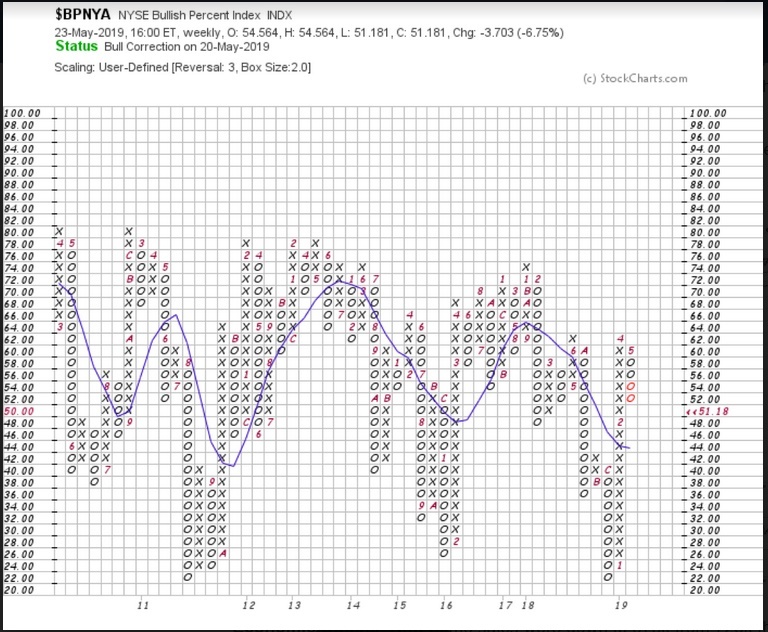
Summary: Measures of market breadth are currently reflecting an environment where internals are weakening over short, intermediate, and long-term time horizons. We will monitor these measures for indications of short-term oversold conditions that could imply a high probability of a rebound in market prices. Those conditions do not exist today.
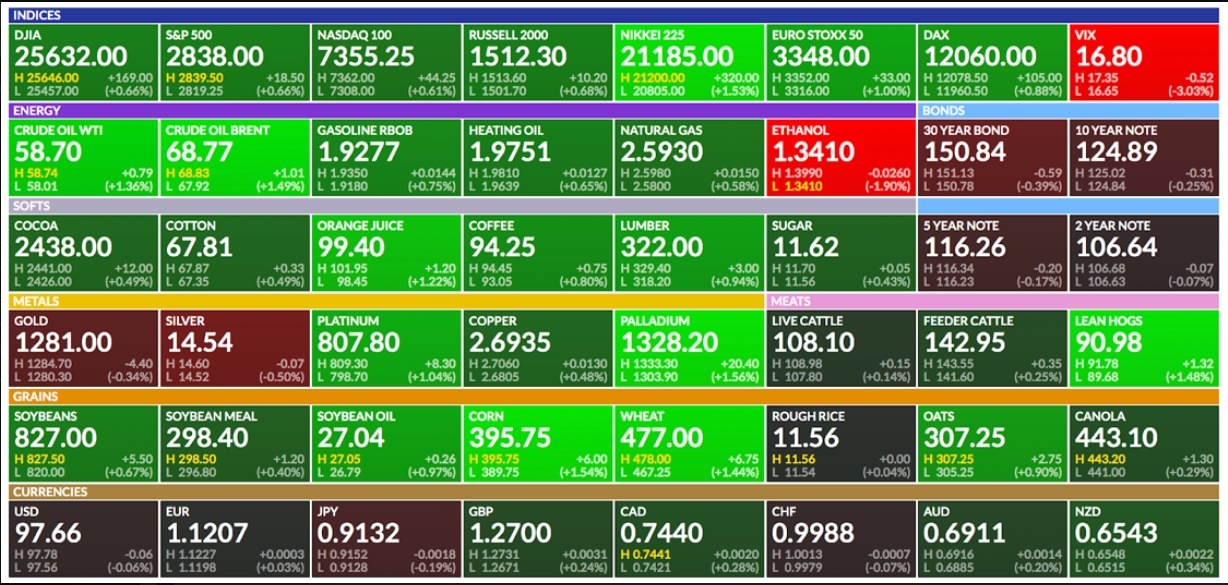
Futures Summary:
News from Bloomberg:
Huawei may be part of a trade deal, President Trump said, in a shift from previous efforts to portray the U.S. campaign against it as a separate issue. "You look at what they've done from a security standpoint, from a military standpoint; it's very dangerous," he said. But a pact to end the trade war remains a "good possibility." So which country is winning? Here's our scoreboard.
Theresa May is stepping down on June 7 after failing to find a parliamentary consensus over Brexit. The U.K. prime minister said a moderate Conservative government was needed, which will be seen as a jibe at the hard-line Brexiteers. She said she was proud of the progress she'd made in reducing the deficit. Here are the Tory rivals jostling for the PM role.
The U.S. may slap tariffs on goods from nations with undervalued currencies. American firms would be able to seek anti-subsidy duties on goods from such states, though no country's actually on a blacklist right now. Still, Dallas Fed chief Robert Kaplan last night warned China may weaken the yuan to help weather the trade war.
Consulting firm McKinsey cut ties with Purdue and said it will no longer advise clients on opioid-related business. The firm has been accused of helping fuel the painkiller epidemic by advising Purdue on how to boost sales of OxyContin over the course of their decade-long relationship. JPMorgan has also stopped working with the drugmaker, Reuters reported.
Stocks are closing the week on a high note. U.S. equity-index futures rose with European shares, and Asian stocks halted a three-day slide. A rebound for oil pared the biggest weekly drop this year. The dollar slipped. The yen, gold and Treasuries were steady. Nickel led industrial metals higher.
WealthShield is a division of Emerald Investment Partners, an SEC Registered Investment Advisor. Advisory services are only offered to clients or prospective clients where WealthShield and it’s representatives are properly licensed or exempt from licensure. Past performance is no guarantee of future returns. Investing involves risk and possible loss of principal capital. No advice may be rendered by WealthShield unless a client service agreement is in place. Before investing, consider your investment objectives and WealthShield’s charges and expenses.
Recommended Content
Editors’ Picks
EUR/USD climbs to 10-day highs above 1.0700

EUR/USD gained traction and rose to its highest level in over a week above 1.0700 in the American session on Tuesday. The renewed US Dollar weakness following the disappointing PMI data helps the pair stretch higher.
GBP/USD extends recovery beyond 1.2400 on broad USD weakness

GBP/USD gathered bullish momentum and extended its daily rebound toward 1.2450 in the second half of the day. The US Dollar came under heavy selling pressure after weaker-than-forecast PMI data and fueled the pair's rally.
Gold rebounds to $2,320 as US yields turn south

Gold reversed its direction and rose to the $2,320 area, erasing a large portion of its daily losses in the process. The benchmark 10-year US Treasury bond yield stays in the red below 4.6% following the weak US PMI data and supports XAU/USD.
Here’s why Ondo price hit new ATH amid bearish market outlook Premium

Ondo price shows no signs of slowing down after setting up an all-time high (ATH) at $1.05 on March 31. This development is likely to be followed by a correction and ATH but not necessarily in that order.
Germany’s economic come back

Germany is the sick man of Europe no more. Thanks to its service sector, it now appears that it will exit recession, and the economic future could be bright. The PMI data for April surprised on the upside for Germany, led by the service sector.