The price of Gold seems to be unimpressed by fears about the coronavirus spread, mainly due to the technical sideways sequence observed in the short-term.
From the Elliott Wave Theory, Gold in its log-scale weekly chart shows a bullish sequence that began in December 2015, when the price of yellow metal found a bottom at $1,046.45 per ounce.
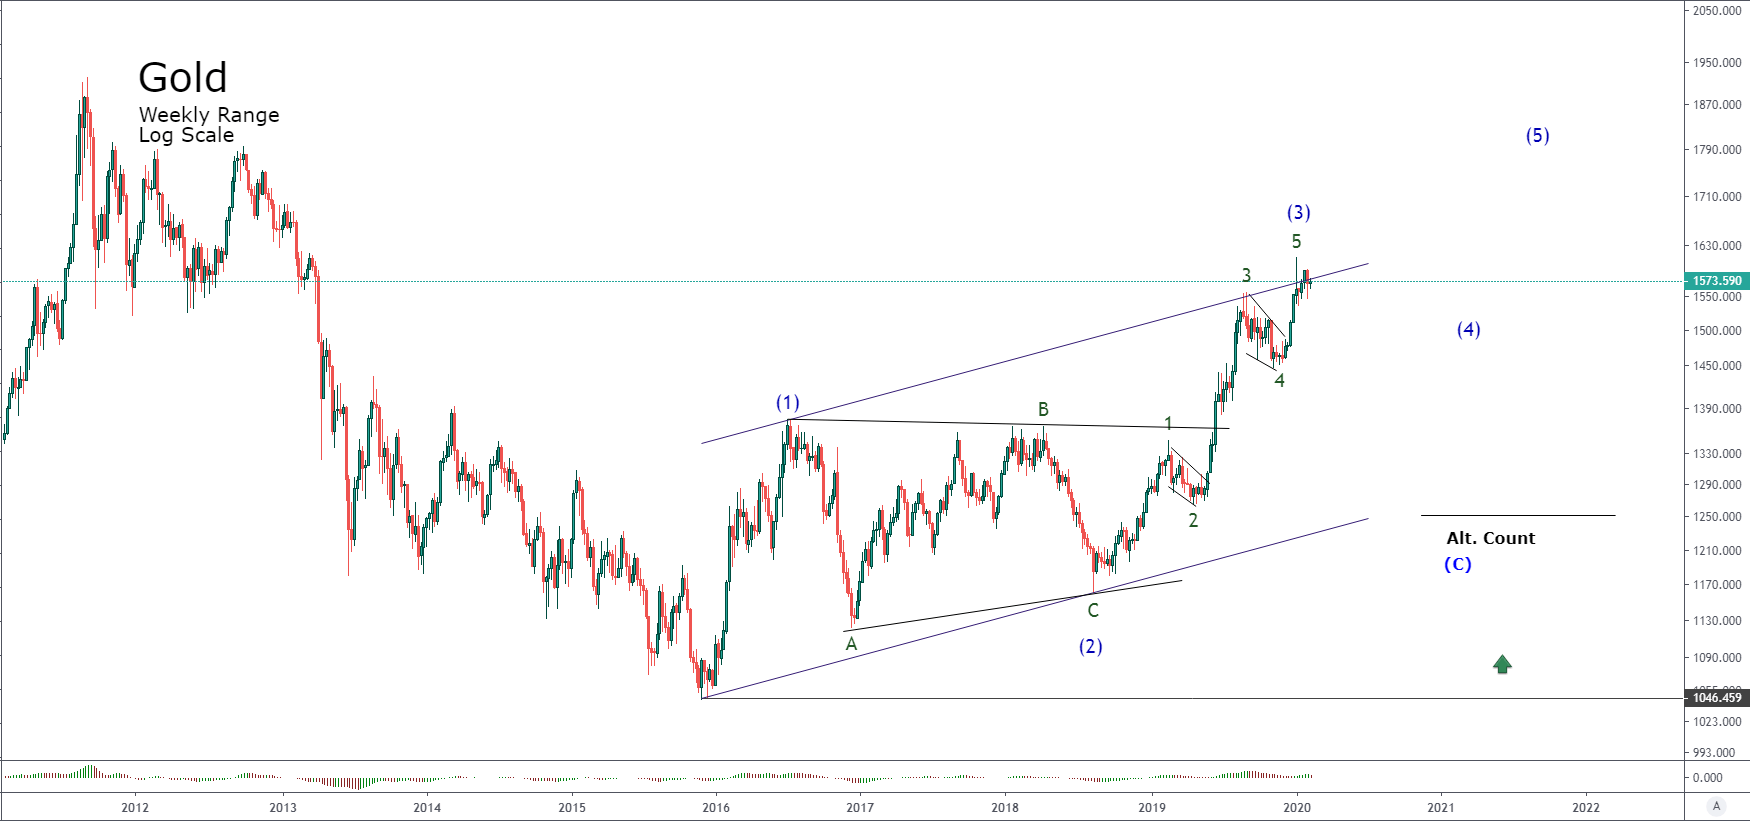
The long-term structure shows the market action advancing in a Wave (3) of intermediate degree, labeled in blue, that peaked at $1,611.48 per ounce in early January 2020. After this impulsive upward movement, the price has remained in a sideways range to date.
An alternative count for the precious metal indicates the possibility that instead of it corresponding to an impulsive wave, the current movement could be an Intermediate Degree wave (C) in blue. This scenario would imply that the price of yellow metal could develop a new bearish leg.
The following figure shows Gold in its daily temporality. On this chart, we observe that the price advances in an intermediate degree Wave (3), which, in turn, shows the wave 5 of a minor degree in green in progress.
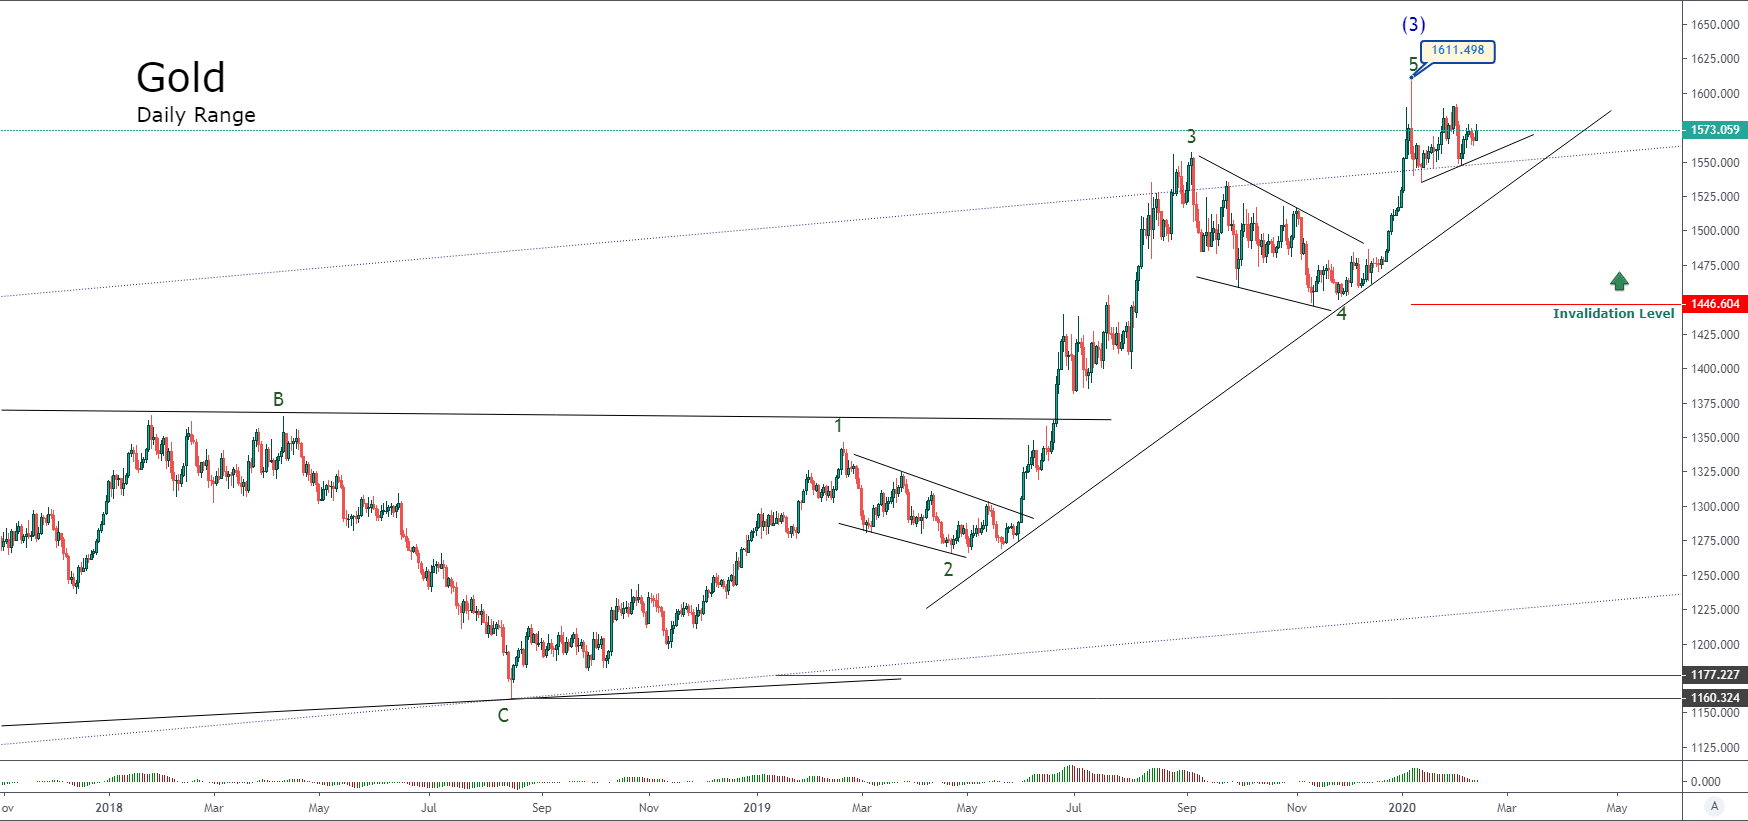
The current bullish cycle remains intact since August 16, 2018, when the yellow metal found fresh buyers at $1,177.22 per ounce. As long as the precious metal remains above $1,446.60, the long-term trend will continue on the bullish side.
The next figure displays the yellow metal in its 4-hour timeframe. On the chart, we distinguish the price action running in the wave 4 of minute degree labeled in black.
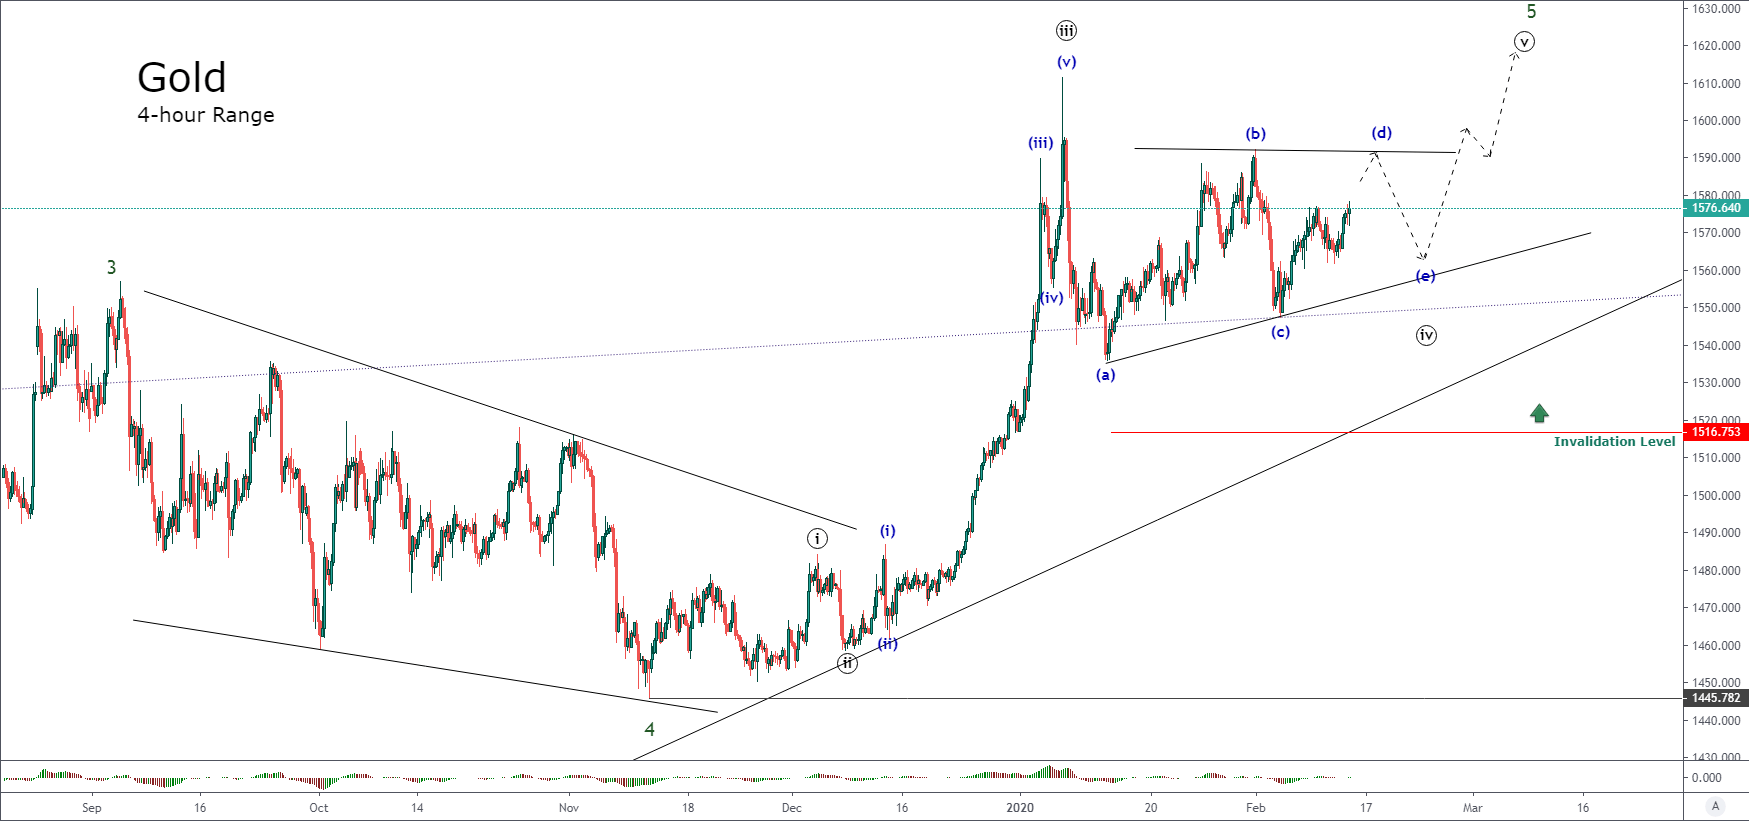
As commented in a previous article, after the rally developed by Gold during December 2019 and ended in early January 2020, it was highly feasible that the price action began an extended sideways correction, likely as a triangle pattern or maybe a complex structure.
In the short-term, as long as Gold remains above $1,516.75 per ounce, our preferred market positioning on this asset will be in the long-side.
In conclusion, short-term Gold continues moving in a sideways path bounded by the February 03 top, at $1,592.16 per ounce. However, from a long-term perspective, the incomplete upward sequence suggests the possibility of a new upside in the precious metal, which could drive Gold to produce new highs above the $1,600 per ounce.
Risk Warning: CFD and Spot Forex trading both come with a high degree of risk. You must be prepared to sustain a total loss of any funds deposited with us, as well as any additional losses, charges, or other costs we incur in recovering any payment from you. Given the possibility of losing more than your entire investment, speculation in certain investments should only be conducted with risk capital funds that if lost will not significantly affect your personal or institution’s financial well-being. Before deciding to trade the products offered by us, you should carefully consider your objectives, financial situation, needs and level of experience. You should also be aware of all the risks associated with trading on margin.
Recommended Content
Editors’ Picks
AUD/USD stands firm above 0.6500 with markets bracing for Aussie PPI, US inflation

The Aussie Dollar begins Friday’s Asian session on the right foot against the Greenback after posting gains of 0.33% on Thursday. The AUD/USD advance was sponsored by a United States report showing the economy is growing below estimates while inflation picked up. The pair traded at 0.6518.
EUR/USD faces a minor resistance near at 1.0750

EUR/USD quickly left behind Wednesday’s small downtick and resumed its uptrend north of 1.0700 the figure, always on the back of the persistent sell-off in the US Dollar ahead of key PCE data on Friday.
Gold soars as US economic woes and inflation fears grip investors

Gold prices advanced modestly during Thursday’s North American session, gaining more than 0.5% following the release of crucial economic data from the United States. GDP figures for the first quarter of 2024 missed estimates, increasing speculation that the US Fed could lower borrowing costs.
Bitcoin price continues to get rejected from $65K resistance as SEC delays decision on spot BTC ETF options

Bitcoin (BTC) price has markets in disarray, provoking a broader market crash as it slumped to the $62,000 range on Thursday. Meanwhile, reverberations from spot BTC exchange-traded funds (ETFs) continue to influence the market.
US economy: Slower growth with stronger inflation

The dollar strengthened, and stocks fell after statistical data from the US. The focus was on the preliminary estimate of GDP for the first quarter. Annualised quarterly growth came in at just 1.6%, down from the 2.5% and 3.4% previously forecast.