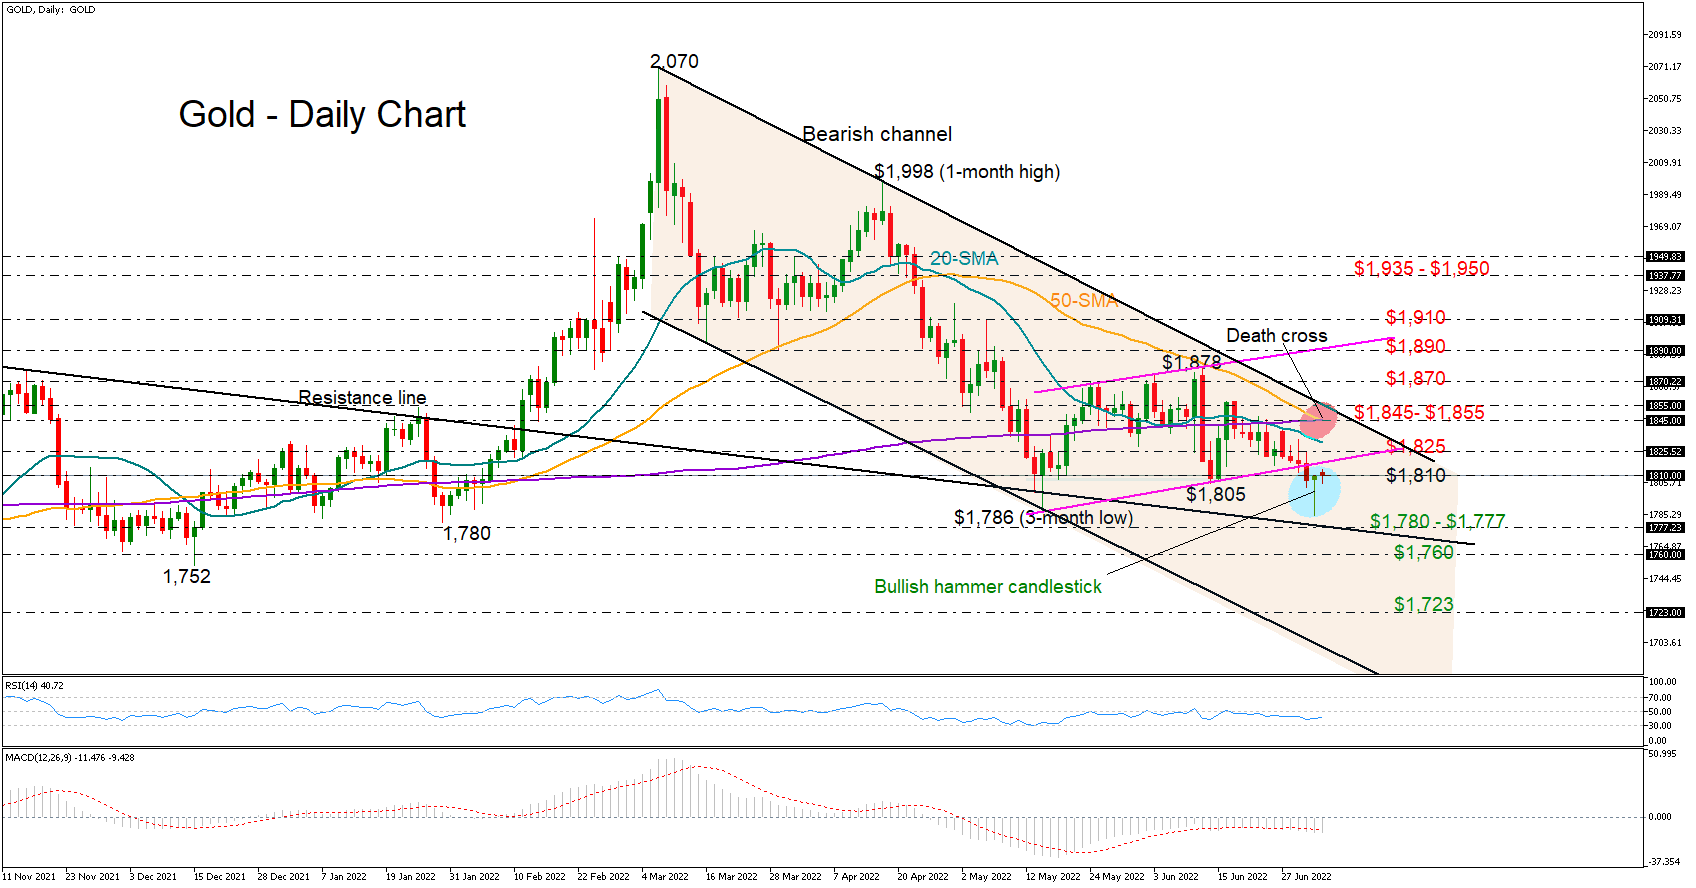
Gold raises a bullish flag, but how strong are the bulls?
Gold optimism started to shine again after the creation of a bullish hammer candlestick on Friday, which succeeded the sharp bounce on May’s bottom of $1,786/ounce.
The price is currently pushing for a higher close slightly above the $1,810 level, trying to confirm the green bullish candlestick formation. Yet, some caution is still required given the negative trend in the RSI and the MACD, which keep hovering within the bearish area.
More importantly, the market is setting up a death cross between the 50- and 200-day simple moving averages (SMAs) after the bearish cross between the 20- and 200-day SMAs last week, suggesting that any upside correction might only be temporary and part of the original negative trend.
Nevertheless, if bullish forces persist, the precious metal will attempt to crawl above the broken support trendline seen at $1,825. Should efforts prove successful, the recovery may continue towards the $1,845 – $1,855 key region, where the longer-term SMAs and the upper boundary of the bearish channel are positioned. Further up, the price may face some congestion around the $1,870 barrier before accelerating towards the surface of the short-term bullish channel at $1,890.
On the downside, the $1,786 – $1,777 floor will remain under the spotlight. If it cracks, the downtrend could stretch towards the support zone around $1,760, while lower, all attention will turn to the 2021 barrier at $1,723.
Summarizing, gold has charted an encouraging candlestick pattern, flagging a potential turnup in the price, but negative risks haven't completely evaporated yet. Perhaps a durable advance above $1,825 could reduce skepticism and motivate additional buying.
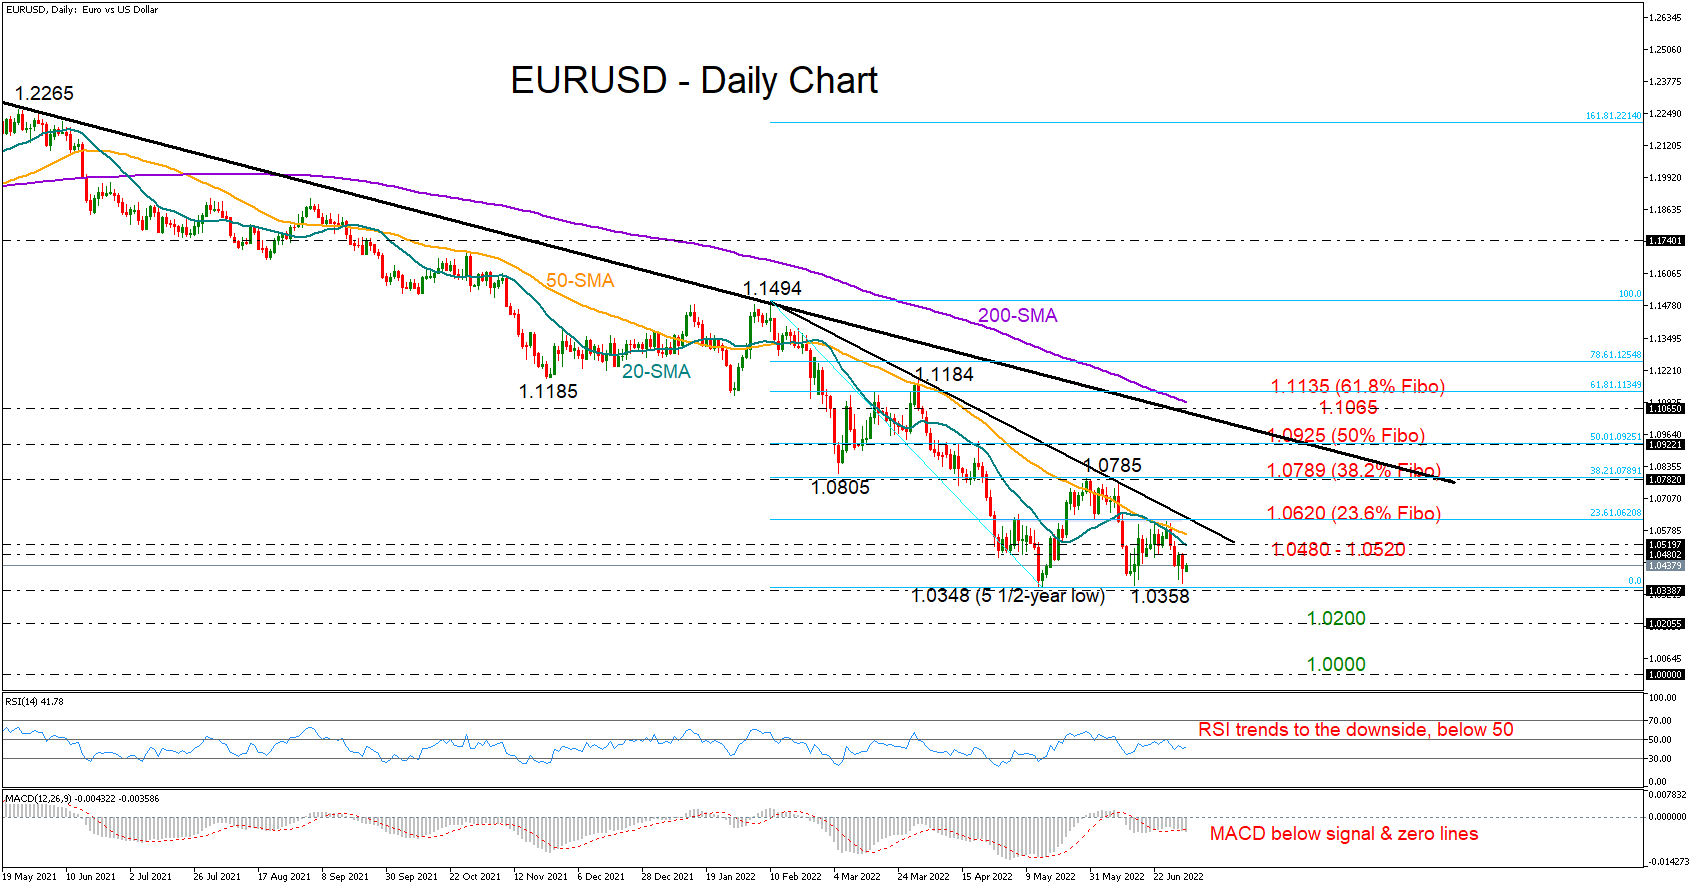
EUR/USD stays afloat above May’s lows; bias still bearish
EURUSD managed to stay afloat above the downtrend’s bottom line of 1.0348 for the third time despite its bearish weekly close. Nevertheless, negative risks keep lingering in the background.
Particularly, the 20-day simple moving average (SMA) has resumed its negative slope after failing to cross above the 50-day SMA, while the RSI and the MACD are also pointing to the downside, with the former distancing itself below its 50 neutral level and the latter deviating beneath its red signal line.
In the event the price tumbles below the 1.0348 floor, breaching the 2017 low of 1.0339 too, the sell-off may intensify towards the crucial 1.0200 psychological level, where the pair changed direction twice during 2002. That might be the last opportunity for a rebound before the pair reach parity. Additional bearish actions from here may next test the 0.9900 number.
On the upside, the 1.0480 – 1.0520 territory and the 20-day SMA appeared as hurdles last week. Hence, a successful extension above that bar could provide direct access to the descending trendline and the 23.6% Fibonacci extension of the 1.1494 – 1.0348 downleg at 1.0620. Higher, the recovery is expected to pick up steam towards the 38.2% Fibonacci of 1.0789, where any violation would put the negative trend at risk.
In brief, although EURUSD maintains a neutral short-term trajectory above May’s 5½-year lows, technical signals remain bearish. Traders may wait for a move below 1.0348 or above 1.0620 before they act accordingly.
Forex trading and trading in other leveraged products involves a significant level of risk and is not suitable for all investors.
Recommended Content
Editors’ Picks
EUR/USD holds gains above 1.0700, as key US data loom

EUR/USD holds gains above 1.0700 in the European session on Thursday. Renewed US Dollar weakness offsets the risk-off market environment, supporting the pair ahead of the key US GDP and PCE inflation data.
GBP/USD extends recovery above 1.2500, awaits US GDP data

GBP/USD is catching a fresh bid wave, rising above 1.2500 in European trading on Thursday. The US Dollar resumes its corrective downside, as traders resort to repositioning ahead of the high-impact US advance GDP data for the first quarter.
Gold price edges higher amid weaker USD and softer risk tone, focus remains on US GDP

Gold price (XAU/USD) attracts some dip-buying in the vicinity of the $2,300 mark on Thursday and for now, seems to have snapped a three-day losing streak, though the upside potential seems limited.
XRP extends its decline, crypto experts comment on Ripple stablecoin and benefits for XRP Ledger

Ripple extends decline to $0.52 on Thursday, wipes out weekly gains. Crypto expert asks Ripple CTO how the stablecoin will benefit the XRP Ledger and native token XRP.
US Q1 GDP Preview: Economic growth set to remain firm in, albeit easing from Q4

The United States Gross Domestic Product (GDP) is seen expanding at an annualized rate of 2.5% in Q1. The current resilience of the US economy bolsters the case for a soft landing.