- Gold keeps the red for the third day in the row amid quiet markets.
- Year-end flows and Treasury yields’ price action will lead the way.
- Gold’s technical setup paints a bearish picture on the 4H chart.
Amid thin year-end liquidity conditions, gold price witnessed volatile trading on Wednesday, falling sharply to $1,790 on a breach of the $1,800 mark. Bulls, however, jumped back into the game and prompted an impressive bounce, as gold price finished at $1,804. Gold price remained under pressure all through the day, courtesy of a rebound in the US Treasury yields following a weak auction of the seven-year rates. Meanwhile, the 70th record close in the US stocks this year combined with easing Omicron fears and outflows from the Treasuries exacerbated the pain in the bright metal. However, the slump in the US dollar to fresh weekly lows, in response to the year-end position adjustments, aided the late rebound in gold price.
In Thursday’s trading so far, gold price is extending the previous bearish momentum, as the Treasury yields hold the recent advance. Meanwhile, the market mood remains cautious, underpinning the dollar’s safe-haven demand at gold’s expense. Investors have moved past the Omicron uncertainty, as the end of the year flows will continue to remain the main driver for gold price alongside the yields in the last couple of trading days of this year. The US Jobless Claims and other minority reports will offer some trading incentives to gold traders.
Gold Price Chart - Technical outlook
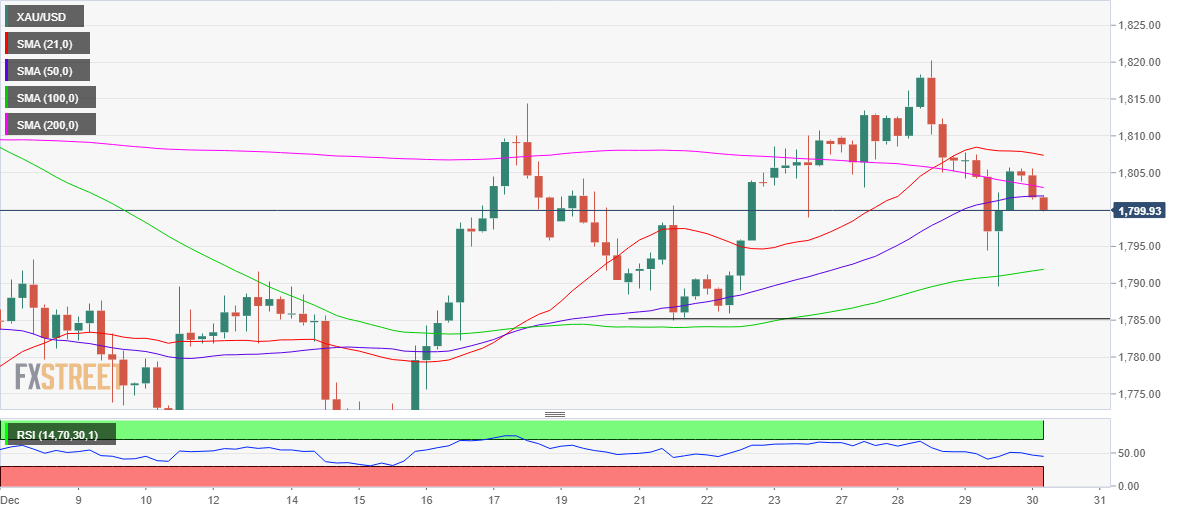
Gold: Four-hour chart
Gold’s four-hour chart shows that bulls lost the recovery battle after facing stiff resistance just below the mildly bearish 21-Simple Moving Average (SMA) at $1,807.
The sell-off that ensued knocked down gold price below the critical 200-SMA and 50-SMA, which converge at $1,802, as of writing.
Gold price is extending the recent losses, with bears looking to retest the ascending 100-SMA support at $1,792.
The next downside target is seen at the horizontal trendline support at $1,785. The Relative Strength Index (RSI) points south below the central line, allowing more declines.
Therefore, gold price is seen defending the horizontal 200-Simple Moving Average (SMA) at $1,805, as of writing.
On the upside, bulls need to recapture the 50 and 200-SMAs confluence area, above which the 21-SMA will come into play.
Recapturing the latter is critical to resuming the uptrend towards the monthly highs of $1,820
Ahead of that level, the previous stubborn resistance at $1,814 will challenge the bulls’ commitments once again.
Information on these pages contains forward-looking statements that involve risks and uncertainties. Markets and instruments profiled on this page are for informational purposes only and should not in any way come across as a recommendation to buy or sell in these assets. You should do your own thorough research before making any investment decisions. FXStreet does not in any way guarantee that this information is free from mistakes, errors, or material misstatements. It also does not guarantee that this information is of a timely nature. Investing in Open Markets involves a great deal of risk, including the loss of all or a portion of your investment, as well as emotional distress. All risks, losses and costs associated with investing, including total loss of principal, are your responsibility. The views and opinions expressed in this article are those of the authors and do not necessarily reflect the official policy or position of FXStreet nor its advertisers. The author will not be held responsible for information that is found at the end of links posted on this page.
If not otherwise explicitly mentioned in the body of the article, at the time of writing, the author has no position in any stock mentioned in this article and no business relationship with any company mentioned. The author has not received compensation for writing this article, other than from FXStreet.
FXStreet and the author do not provide personalized recommendations. The author makes no representations as to the accuracy, completeness, or suitability of this information. FXStreet and the author will not be liable for any errors, omissions or any losses, injuries or damages arising from this information and its display or use. Errors and omissions excepted.
The author and FXStreet are not registered investment advisors and nothing in this article is intended to be investment advice.
Recommended Content
Editors’ Picks
EUR/USD retreats below 1.0700 after US GDP data

EUR/USD came under modest bearish pressure and retreated below 1.0700. Although the US data showed that the economy grew at a softer pace than expected in Q1, strong inflation-related details provided a boost to the USD.
GBP/USD declines below 1.2500 as USD rebounds

GBP/USD declined below 1.2500 and erased the majority of its daily gains with the immediate reaction to the US GDP report. The US economy expanded at a softer pace than expected in Q1 but the price deflator jumped to 3.4% from 1.8%.
Gold drops below $2,320 as US yields shoot higher

Gold lost its traction and turned negative on the day below $2,320 in the American session on Thursday. The benchmark 10-year US Treasury bond yield is up more than 1% on the day above 4.7% after US GDP report, weighing on XAU/USD.
XRP extends its decline, crypto experts comment on Ripple stablecoin and benefits for XRP Ledger

Ripple extends decline to $0.52 on Thursday, wipes out weekly gains. Crypto expert asks Ripple CTO how the stablecoin will benefit the XRP Ledger and native token XRP.
After the US close, it’s the Tokyo CPI

After the US close, it’s the Tokyo CPI, a reliable indicator of the national number and then the BoJ policy announcement. Tokyo CPI ex food and energy in Japan was a rise to 2.90% in March from 2.50%.