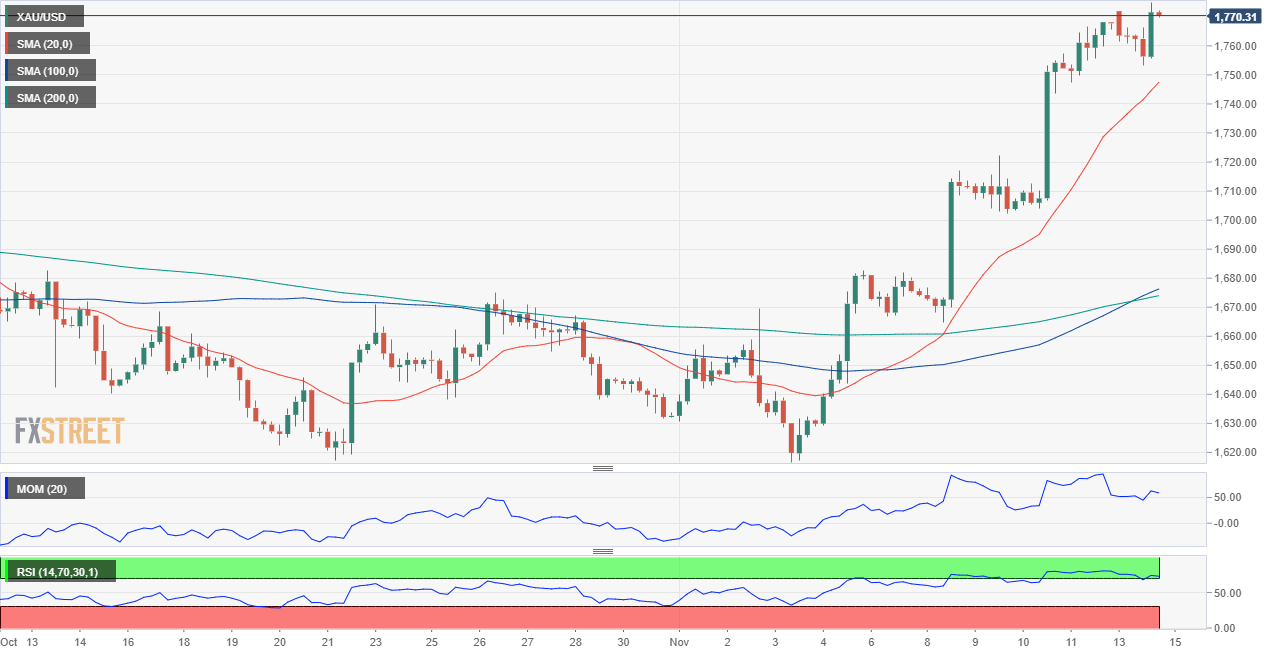
XAUUSD Current price: $1,770.31
- Signs of easing US inflation spurred a US Dollar sell-off that extends in the new week.
- Biden-Xi meeting within G-20 put the focus on Taiwan.
- XAUUSD reached a fresh three-month high and is poised to keep advancing.
The American Dollar recovered some ground on Monday but quickly resumed its decline ahead of the US opening as investors keep moving away from it. Spot gold started the day with a soft tone and fell to an intraday low of $1,753.19 a troy ounce, now trading near a fresh three-month high in the $1,775 price zone.
Financial markets are quieter following two days of wild price action spurred by signs of easing inflation in the United States. The October Consumer Price Index (CPI) rose at an annual pace of 7.7%, much lower than the 8% anticipated by the market or the record peak of 9.1% from last June. Investors rushed to drop the US Dollar amid speculation the US Federal Reserve will pivot on monetary policy in their upcoming December meeting.
Meanwhile, US President Joe Biden met with his Chinese counterpart Xi Jinping. The versions of the outcome differ according to national sources. On the one hand, US President Biden said that they are not looking for conflict and that there will not be a new Cold War. On the other, Chinese media reported that President Xi warned his US counterpart about crossing a “red line” in Taiwan. Both Presidents said they want to find the right direction and manage their differences.
The US Dollar remains under pressure, despite fading optimism. Wall Street trades mixed, with only the Dow Jones Industrial Average posting some modest gains.
XAUUSD price short-term technical outlook
The daily chart for the XAUUSD pair favors a continued advance, with market players eyeing a potential breakout of the $1,800 mark. Technical indicators in the mentioned time frame consolidate within overbought levels without signs of upward exhaustion. At the same time, the bright metal develops above its 20 and 100 SMAs, with the shorter one advancing below the longer one. Finally, the 200 SMA reinforces the resistance area around the aforementioned threshold, now at $1,803.15.
The near-term picture favors higher highs ahead. In the 4-hour chart, technical indicators turned marginally higher despite standing in overbought territory as the pair develops above bullish moving averages. The 20 SMA guides the metal higher, while the 100 SMA is crossing above the 200 SMA, both far below the current level at around $1,670, still reflecting buyers’ strength.
Support levels: 1,762.90 1,750.00 1,738.35
Resistance levels: 1,782.30 1,794.60 1,803.15
Information on these pages contains forward-looking statements that involve risks and uncertainties. Markets and instruments profiled on this page are for informational purposes only and should not in any way come across as a recommendation to buy or sell in these assets. You should do your own thorough research before making any investment decisions. FXStreet does not in any way guarantee that this information is free from mistakes, errors, or material misstatements. It also does not guarantee that this information is of a timely nature. Investing in Open Markets involves a great deal of risk, including the loss of all or a portion of your investment, as well as emotional distress. All risks, losses and costs associated with investing, including total loss of principal, are your responsibility. The views and opinions expressed in this article are those of the authors and do not necessarily reflect the official policy or position of FXStreet nor its advertisers. The author will not be held responsible for information that is found at the end of links posted on this page.
If not otherwise explicitly mentioned in the body of the article, at the time of writing, the author has no position in any stock mentioned in this article and no business relationship with any company mentioned. The author has not received compensation for writing this article, other than from FXStreet.
FXStreet and the author do not provide personalized recommendations. The author makes no representations as to the accuracy, completeness, or suitability of this information. FXStreet and the author will not be liable for any errors, omissions or any losses, injuries or damages arising from this information and its display or use. Errors and omissions excepted.
The author and FXStreet are not registered investment advisors and nothing in this article is intended to be investment advice.
Recommended Content
Editors’ Picks
AUD/USD hovers around 0.6500 amid light trading, ahead of US GDP

AUD/USD is trading close to 0.6500 in Asian trading on Thursday, lacking a clear directional impetus amid an Anzac Day holiday in Australia. Meanwhile, traders stay cautious due ti risk-aversion and ahead of the key US Q1 GDP release.
USD/JPY finds its highest bids since 1990, near 155.50

USD/JPY keeps breaking into its highest chart territory since June of 1990 early Thursday, testing 155.50 for the first time in 34 years as the Japanese Yen remains vulnerable, despite looming Japanese intervention risks. Focus shifts to Thursday's US GDP report and the BoJ decision on Friday.
Gold price lacks firm intraday direction, holds steady above $2,300 ahead of US data

Gold price remains confined in a narrow band for the second straight day on Thursday. Reduced Fed rate cut bets and a positive risk tone cap the upside for the commodity. Traders now await key US macro data before positioning for the near-term trajectory.
Injective price weakness persists despite over 5.9 million INJ tokens burned
Injective price is trading with a bearish bias, stuck in the lower section of the market range. The bearish outlook abounds despite the network's deflationary efforts to pump the price. Coupled with broader market gloom, INJ token’s doomed days may not be over yet.
Meta Platforms Earnings: META sinks 10% on lower Q2 revenue guidance Premium

This must be "opposites" week. While Doppelganger Tesla rode horrible misses on Tuesday to a double-digit rally, Meta Platforms produced impressive beats above Wall Street consensus after the close on Wednesday, only to watch the share price collapse by nearly 10%.