Gold is currently trading at $1,323 and could rise toward the crucial 100-month moving average (MA), currently at $1,354 if the dollar index confirms a bear reversal with a close below 96.83 tomorrow.
The yellow metal picked up a strong bid Friday as the markets offered the greenback on the rising odds of a US-China trade deal.
The dollar index, which tracks the value of the greenback against majors, carved out a bearish outside-day, as seen in the chart below.
DXY daily chart
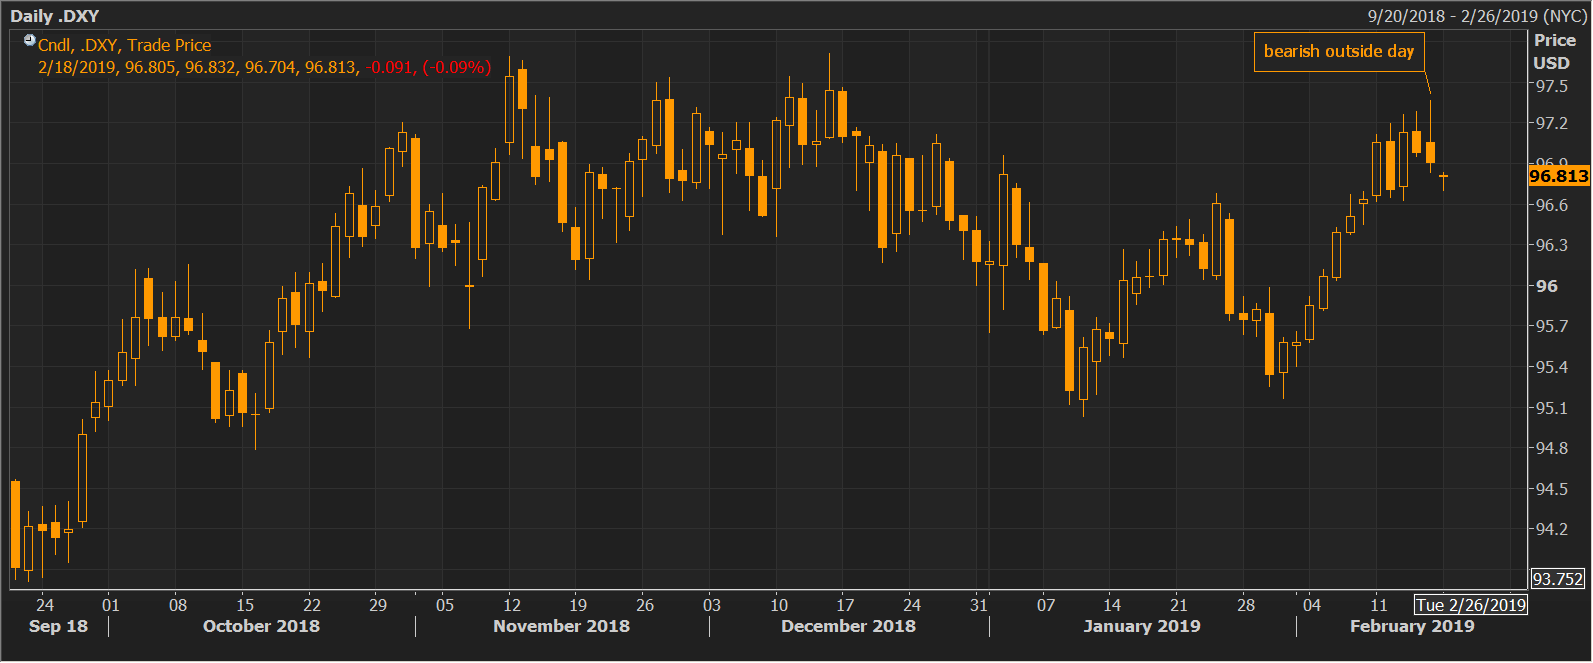
Friday's bearish outside day indicates the rally from the Jan. 31 low of 95.16 has likely run out of steam at highs above 97.30. A bearish reversal, however, would be confirmed if DXY closes tomorrow below 96.83.
Usually, the close of the day after the bearish outside candle is pivotal. However, with the US observing a trading holiday today, the liquidity will likely be thin. As a result, Tuesday's close will validate Friday's bearish outside day.
A close below 96.83 could be followed by a drop to 95.16 (Jan. 31 low). After all, the focus seems to have shifted from the Eurozone recession fears to the US-China trade optimism and the growing evidence of a slowdown in the US.
A bearish reversal in the dollar index, if confirmed, could bode well for the yellow metal. Notably, the metal is already looking north as per technical charts.
Gold daily chart
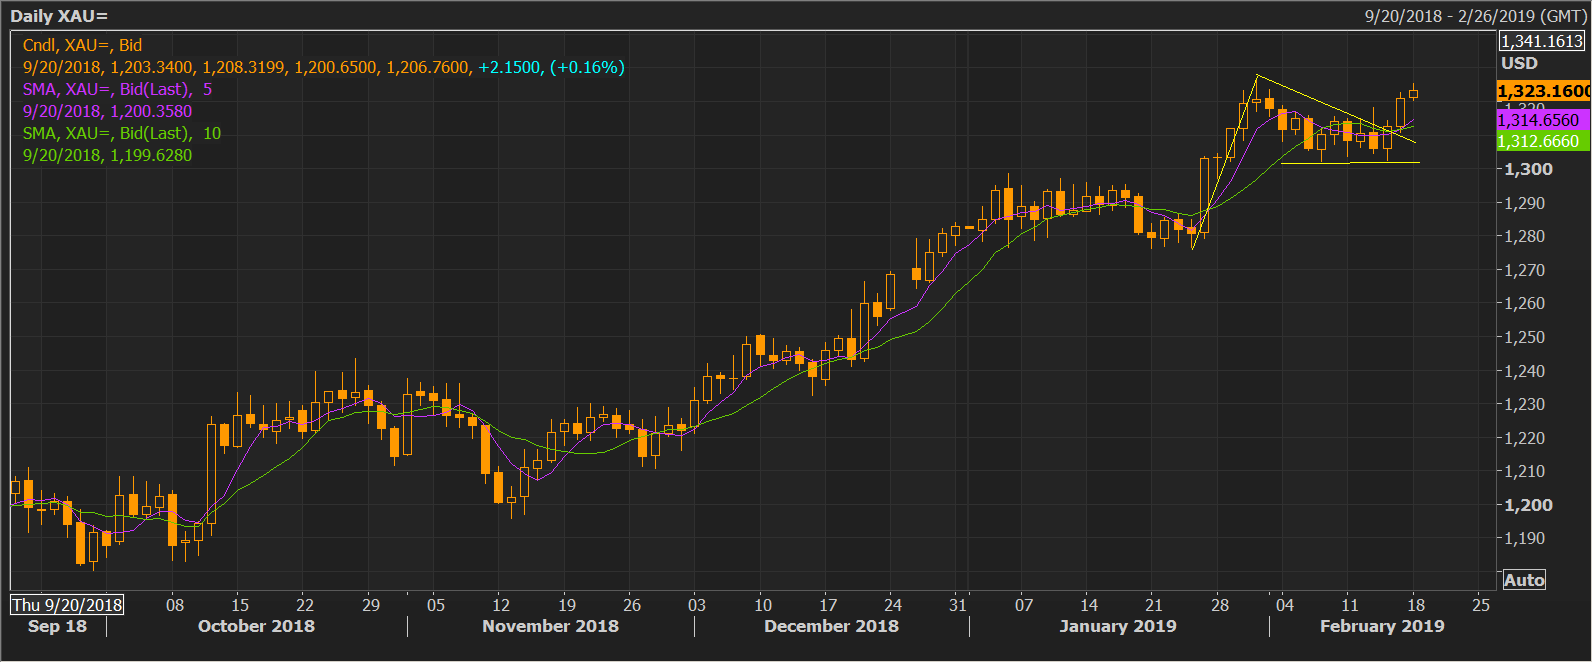
The ascending triangle breakout confirmed on Thursday signaled a resumption of the rally from the Jan. 24 low of $1,276 and has likely opened upside toward $1,259 (target as per the measured move method). Interstingly, the crucial 100-month MA is currently located at $1,254.
Supporting that bullish case is the above-50 print on the 14-day relative strength index (RSI). Further, the 5- and 10-day moving averages (MAs) are again trending north in favor of the bulls.
Gold monthly chart
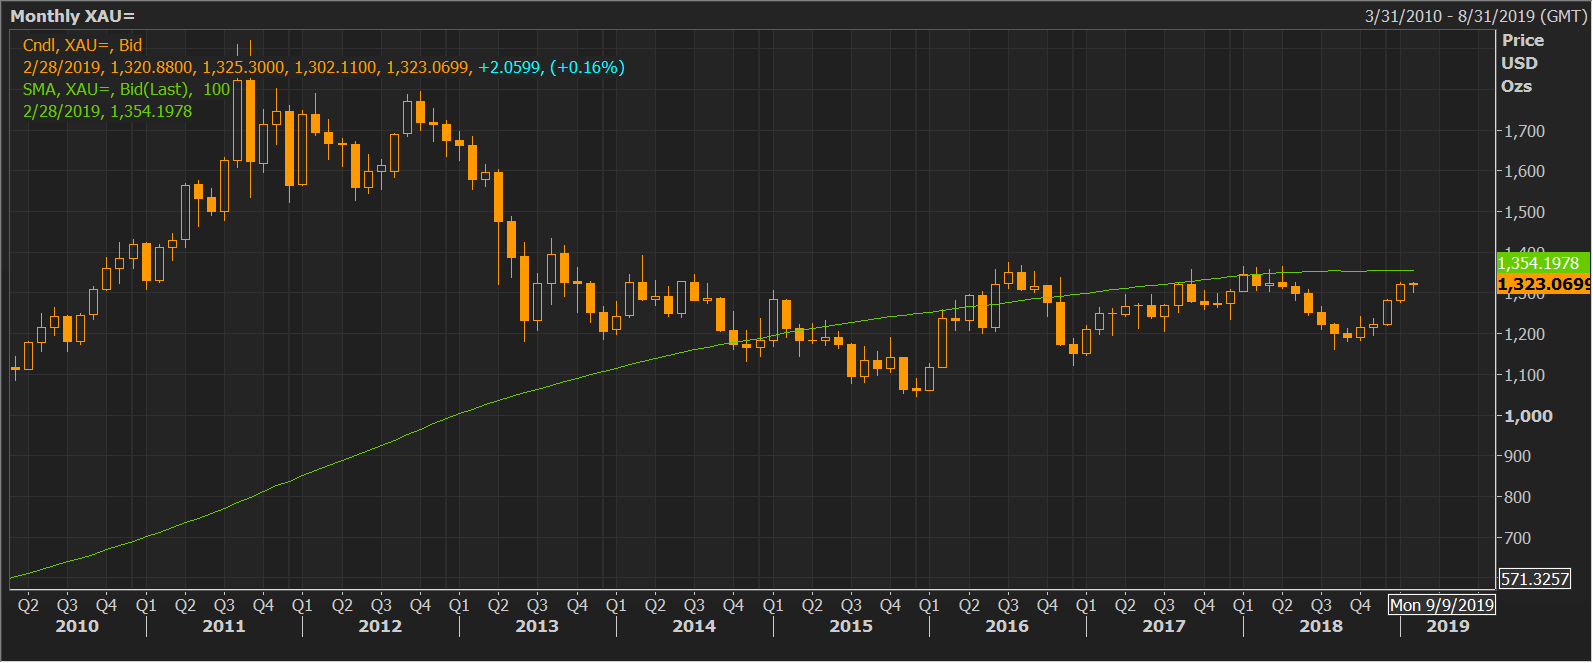
As seen above, the recovery from the December 2016 low of $1,122 repeatedly failed to penetrade the 100-month MA in nine months leading up to April 2018.
The 100-month MA, therefore, is the level to beat for the bulls. A close above that average would open up upside towards $1,500.
Information on these pages contains forward-looking statements that involve risks and uncertainties. Markets and instruments profiled on this page are for informational purposes only and should not in any way come across as a recommendation to buy or sell in these assets. You should do your own thorough research before making any investment decisions. FXStreet does not in any way guarantee that this information is free from mistakes, errors, or material misstatements. It also does not guarantee that this information is of a timely nature. Investing in Open Markets involves a great deal of risk, including the loss of all or a portion of your investment, as well as emotional distress. All risks, losses and costs associated with investing, including total loss of principal, are your responsibility. The views and opinions expressed in this article are those of the authors and do not necessarily reflect the official policy or position of FXStreet nor its advertisers. The author will not be held responsible for information that is found at the end of links posted on this page.
If not otherwise explicitly mentioned in the body of the article, at the time of writing, the author has no position in any stock mentioned in this article and no business relationship with any company mentioned. The author has not received compensation for writing this article, other than from FXStreet.
FXStreet and the author do not provide personalized recommendations. The author makes no representations as to the accuracy, completeness, or suitability of this information. FXStreet and the author will not be liable for any errors, omissions or any losses, injuries or damages arising from this information and its display or use. Errors and omissions excepted.
The author and FXStreet are not registered investment advisors and nothing in this article is intended to be investment advice.
Recommended Content
Editors’ Picks
AUD/USD remained bid above 0.6500

AUD/USD extended further its bullish performance, advancing for the fourth session in a row on Thursday, although a sustainable breakout of the key 200-day SMA at 0.6526 still remain elusive.
EUR/USD faces a minor resistance near at 1.0750

EUR/USD quickly left behind Wednesday’s small downtick and resumed its uptrend north of 1.0700 the figure, always on the back of the persistent sell-off in the US Dollar ahead of key PCE data on Friday.
Gold holds around $2,330 after dismal US data

Gold fell below $2,320 in the early American session as US yields shot higher after the data showed a significant increase in the US GDP price deflator in Q1. With safe-haven flows dominating the markets, however, XAU/USD reversed its direction and rose above $2,340.
Bitcoin price continues to get rejected from $65K resistance as SEC delays decision on spot BTC ETF options

Bitcoin (BTC) price has markets in disarray, provoking a broader market crash as it slumped to the $62,000 range on Thursday. Meanwhile, reverberations from spot BTC exchange-traded funds (ETFs) continue to influence the market.
US economy: slower growth with stronger inflation

The dollar strengthened, and stocks fell after statistical data from the US. The focus was on the preliminary estimate of GDP for the first quarter. Annualised quarterly growth came in at just 1.6%, down from the 2.5% and 3.4% previously forecast.