Gold continues moving around the price of $1780/oz - $1785/oz. This action shows the cautiousness of investors in the economic recovery and the excessive increase of Bitcoin. In the London session and New York session today, the moving will lead gold trendline in the next 3 days.
The DXY - US Dollar Index, moving around 90.3 - 90.5. Similar to Gold, the DXY is in an retesting uptrend after a dropping on 17th February, under the impact of the economic stimulus package of $1,900 billion, that was just approved last week.
Trend analysis
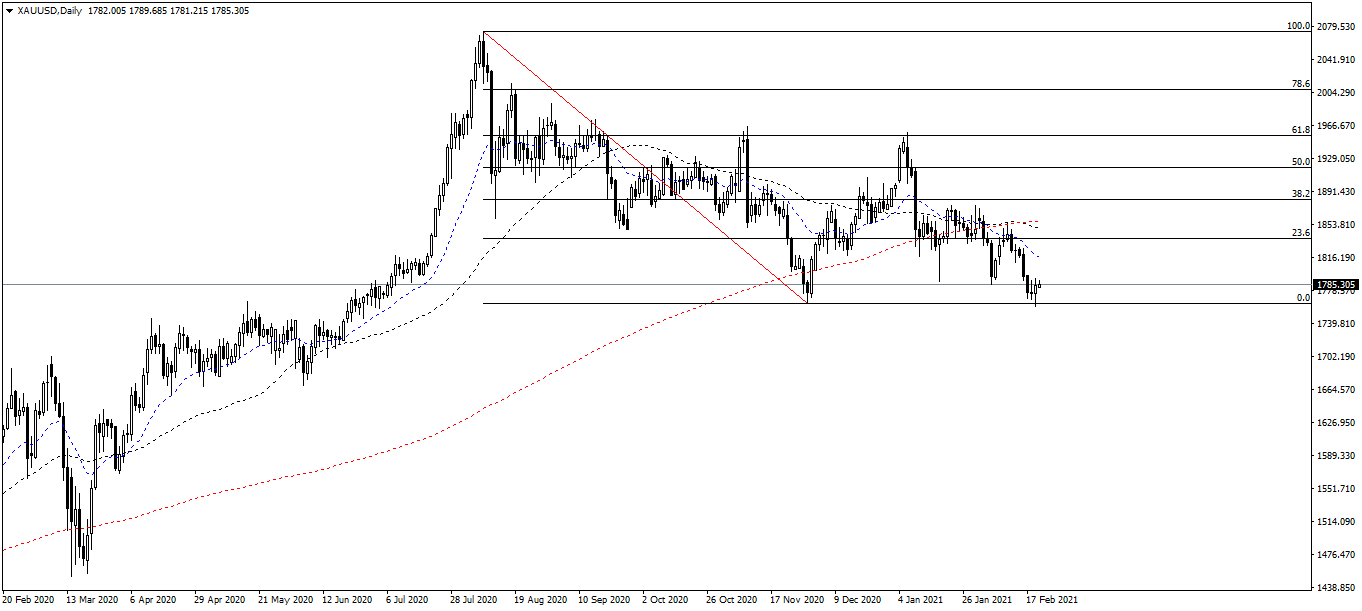
On the Daily chart, Gold breaks the Uptrend (which formed from April 2020). After showing signs of breaking, Gold increased slightly from $1760/oz to $1780/oz, this is considered a process of "retesting trend". Investors should observe the price range from $1780/oz - $1800/oz to have a reasonable investment decision.
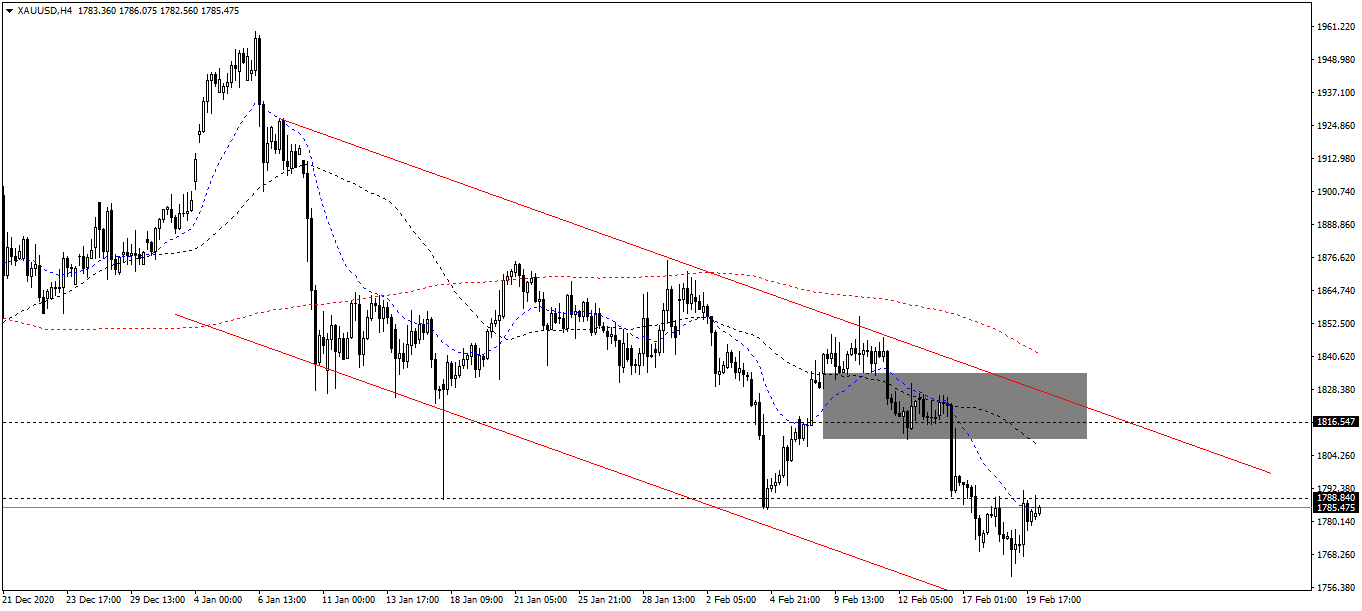
On the 4-hour chart, Gold continues its trend of recovery and is going in the "price channel" of $1926/oz - $1756/oz.
Resistance/Support Analysis (Supply/Demand)
After breaking the support level of $1790/oz last week, the price suddenly rose again and tested the old support zone (which becoming the new resistance zone). The $1790/oz is very sensitive. If Gold breaks this resistance, the short-term target will go up to $1810/oz - $1830/oz. In the other hand, if Gold fails to break this resistance, I recommend that you could have sell orders.
The Resistance levels are $1790/oz, $1810/oz and $1830/oz.
The Support levels are $1740/oz and $1760/oz.
Fibonacci analysis
The Fibonacci tool is measured on the daily chart at the 2070/1760 level. After reaching to the Fibonacci 0 ($1760/oz) and going up in the previous week. This week, Gold continues to keep the price close to the Fibonacci 0.
Moving average MA
Note:
The 20 EMA is the blue line on the chart.
The 50 SMA is the black line on the chart.
The 200 SMA is the red line on the chart.
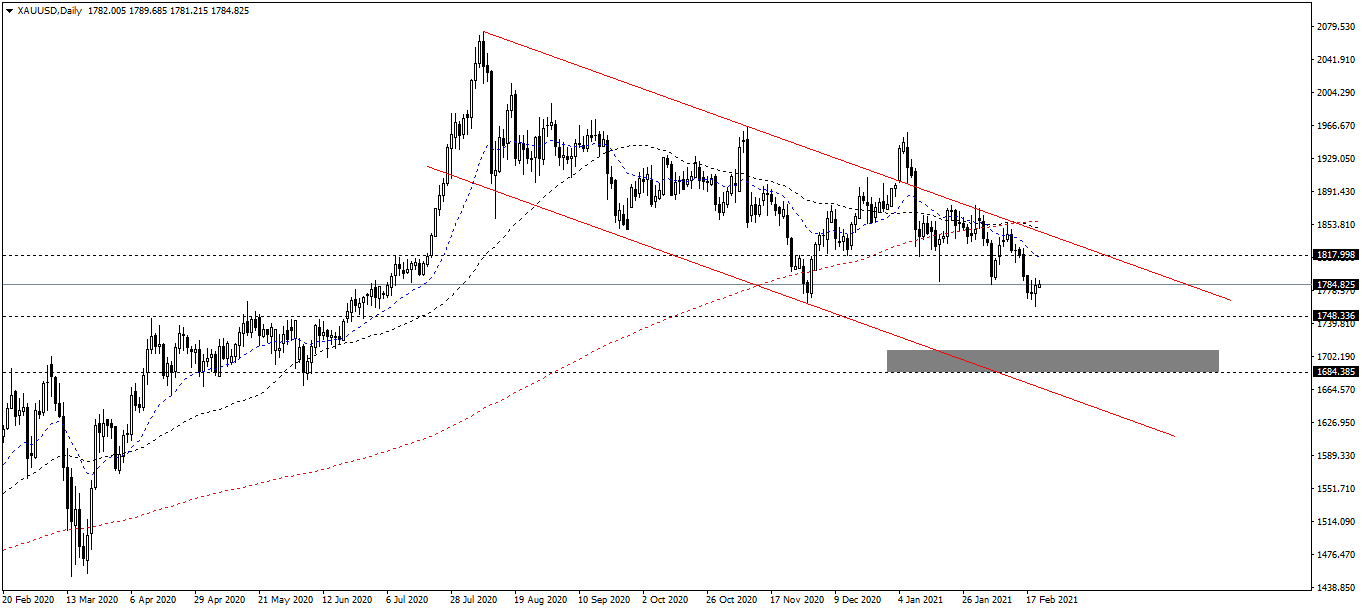
On the Daily chart, as I mentioned in the latest analysis, the EMA20/SMA50 moving average cross sed the SMA200 moving average and continues to go down. There is no reversal signal appearing in this chart. The SMA200 is considered a dynamic resistance.
On the 4-hour chart, the EMA20 moving average shows a bullish reversal signal. This is exactly same as Daily chart I have mentioned above. However, because the SMA50 has not reversed yet, which has not cut the SMA200, so I think this is a short-term correction signal.
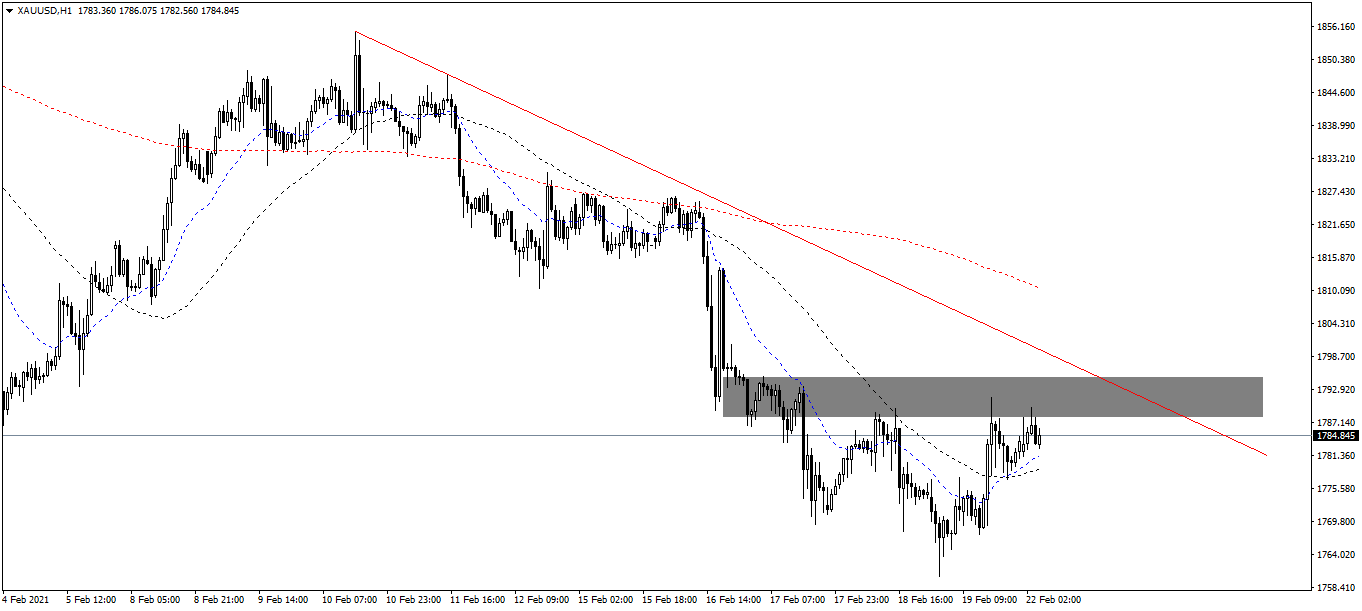
On the 1-hour chart, the EMA20 moving average crossed the SMA50 moving average and went up, similar to the 4-hour chart, the signal has appeared and continues to accumulate. The SMA200 is considered a dynamic resistance zone and with the resistances which I mentioned above, are static resistance. Recommendation at the moment is buying short-term, keep the selling trend in medium-term and long-term.
Note: All information on this page is subject to change. The use of this website constitutes acceptance of our user agreement. Please read our privacy policy and legal disclaimer. Opinions expressed at FXstreet.com are those of the individual authors and do not necessarily represent the opinion of FXstreet.com or its management. Risk Disclosure: Trading foreign exchange on margin carries a high level of risk, and may not be suitable for all investors. The high degree of leverage can work against you as well as for you. Before deciding to invest in foreign exchange you should carefully consider your investment objectives, level of experience, and risk appetite. The possibility exists that you could sustain a loss of some or all of your initial investment and therefore you should not invest money that you cannot afford to lose. You should be aware of all the risks associated with foreign exchange trading, and seek advice from an independent financial advisor if you have any doubts.
Recommended Content
Editors’ Picks
EUR/USD hovers around 1.0700 after German IFO data

EUR/USD stays in a consolidation phase at around 1.0700 in the European session on Wednesday. Upbeat IFO sentiment data from Germany helps the Euro hold its ground as market focus shifts to US Durable Goods Orders data.
USD/JPY refreshes 34-year high, attacks 155.00 as intervention risks loom

USD/JPY is renewing a multi-decade high, closing in on 155.00. Traders turn cautious on heightened risks of Japan's FX intervention. Broad US Dollar rebound aids the upside in the major. US Durable Goods data are next on tap.
Gold price trades with mild negative bias, manages to hold above $2,300 ahead of US data

Gold price (XAU/USD) edges lower during the early European session on Wednesday, albeit manages to hold its neck above the $2,300 mark and over a two-week low touched the previous day.
Worldcoin looks set for comeback despite Nvidia’s 22% crash Premium

Worldcoin price is in a better position than last week's and shows signs of a potential comeback. This development occurs amid the sharp decline in the valuation of the popular GPU manufacturer Nvidia.
Three fundamentals for the week: US GDP, BoJ and the Fed's favorite inflation gauge stand out Premium

While it is hard to predict when geopolitical news erupts, the level of tension is lower – allowing for key data to have its say. This week's US figures are set to shape the Federal Reserve's decision next week – and the Bank of Japan may struggle to halt the Yen's deterioration.