![]() Mario Blascak, PhD
Mario Blascak, PhD
Independent Analyst
It was a pretty flat week for Sterling with only minor economic data due in the UK. The GBP/USD stayed flat in the eleventh week of 2018 opening last week at 1.3850 and ending just below 1.3900 level ahead of data-packed he third week of March headlined by key European summit due on March 22 and 23 that is set to decide on Brexit destiny.
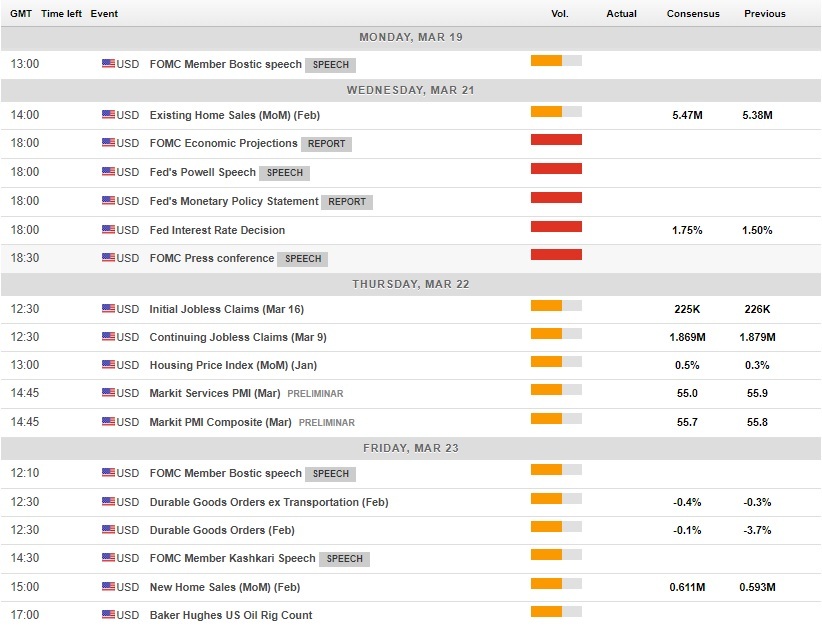
Although GBP/USD rose to 1.3995 level during the last week on US Dollar driven political events, the US Gained traction since Wednesday supported by solid economic data and more importantly by the interest rate outlook. During the week starting March 19, both the Federal Reserve Bank and the Bank of England are set to meet for monetary policy decisions. While the Federal Open Market Committee (FOMC) is broadly expected to hike rates by 25 basis points, the Bank of England is mired in Brexit-related economic uncertainty and it is seen holding rates steady.
Apart from the central banks meeting, the most important economic data pack is expected to be delivered in the UK with February inflation and January wages and unemployment data due next week.
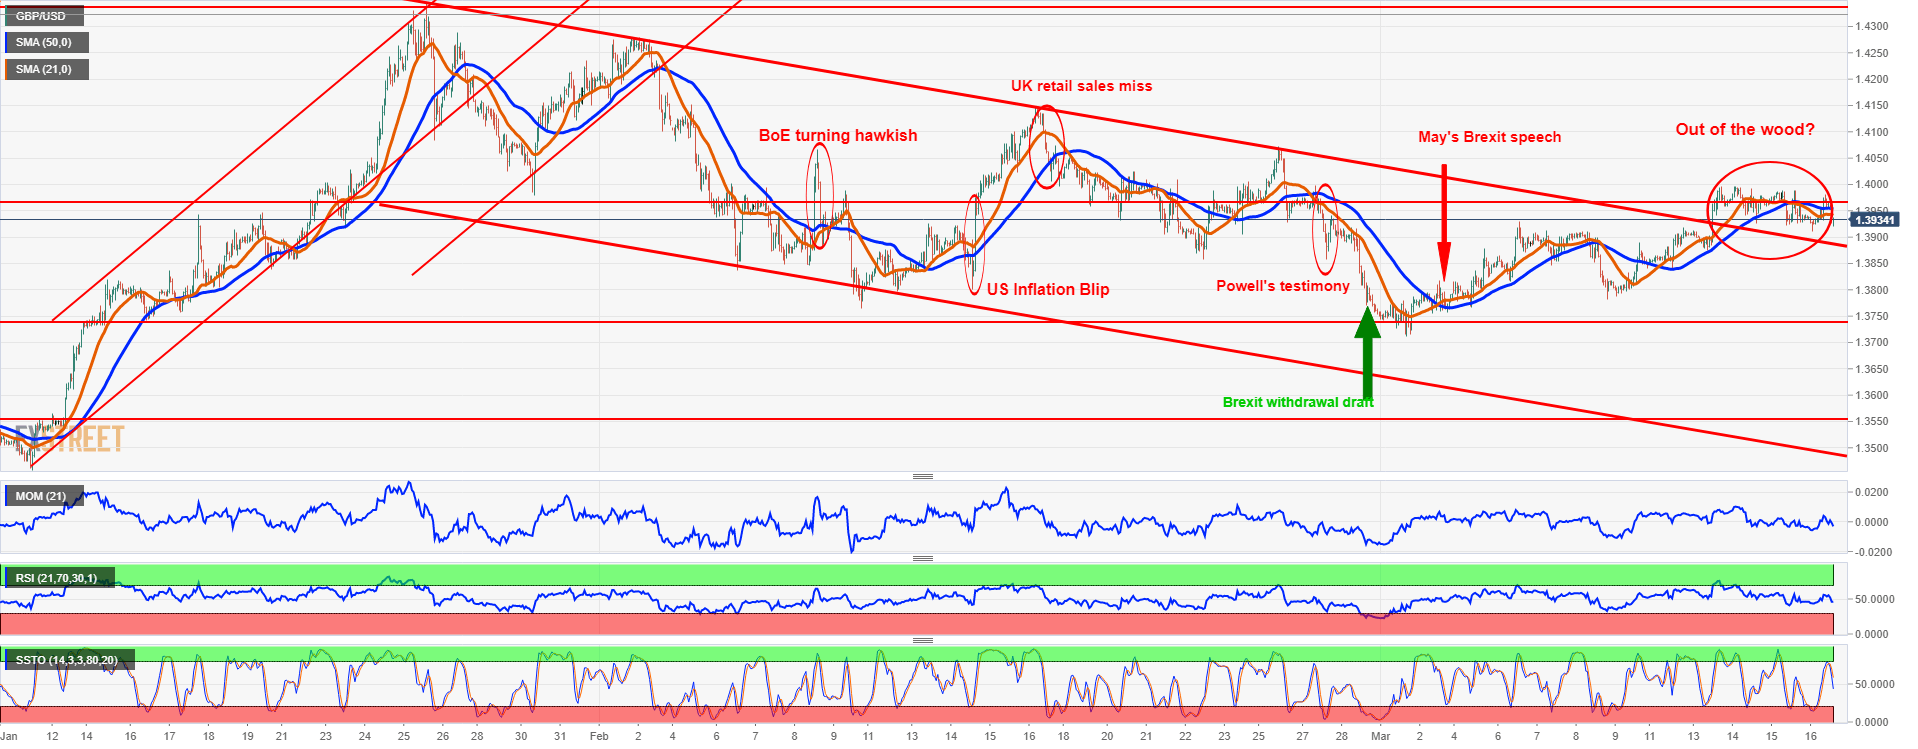
Technically, the GBP/USD was able to break from the downward sloping trend on 1-hour chart, even as it is set to finish the week locked below important Fibonacci retracement line of 1.3965.
GBP/USD 1-week chart
European summit and Brexit transition period
The European summit in Brussels scheduled for March 22-23 plays a key role in determining the currency action next week. The vision of mutual steps back in Brexit negotiations outlined in the UK Prime Minister Theresa May’s recent policy speech is likely to see the materialization next Friday. Progress has been reported over the past few days, following several weeks of stagnation, but the general view of a deal being reached prevails among politicians even with the dispute over the Irish border.
Transition timeline is probably the area with the biggest progress as both sides. Despite different views on time-horizon, the vision is clear that the transition period must be finite. The EU claims December 2020 as the end of the transition period that coincides with the end of the current EU budget period while the UK government favors longer period. The likelihood of reaching the deal is big because once the timeline is given, going beyond December 2020 would require the additional financial commitment to EU budget that is politically sensitive.
Getting the transition deal done by next Friday will be very important and very positive signal for the UK business as it will provide a solid anchor in the sea of Brexit uncertainty that could possibly in combination with solid wage growth due next Wednesday open the door for the Bank of England to increase the Bank rate in May. The clues bringing the likelihood of May rate hike might also be provided in Bank of England’s statement next Thursday as the Monetary Policy Committee (MPC) is set to convene.
The biggest source of Brexit negotiations related uncertainty is the dispute over the Irish border. Back in December last year, the UK government committed to "no regulatory divergence" between Ireland and Northern Ireland, but while the UK is leaving the customs union and the UK still wants to keep the post-Brexit free trade flowing, major differences in views prevail, possibly blocking the whole process. Both sides remain poles apart on the Irish border situation.
Upcoming macro data
The UK economic calendar is pretty intensive during the third week of March with February inflation numbers and January wage growth headlining the week ahead.
After being stuck to 3.0% for last two months, the UK inflation rate is expected to finally start to decelerate in February with headline Consumer Price Index (CPI) seen decelerating to 2.9% y/y and core inflation expected to decelerate to 2.5% y/y, the Office for National Statistics (ONS) is due to announce on Tuesday.
The UK economic calendar for March 19-23
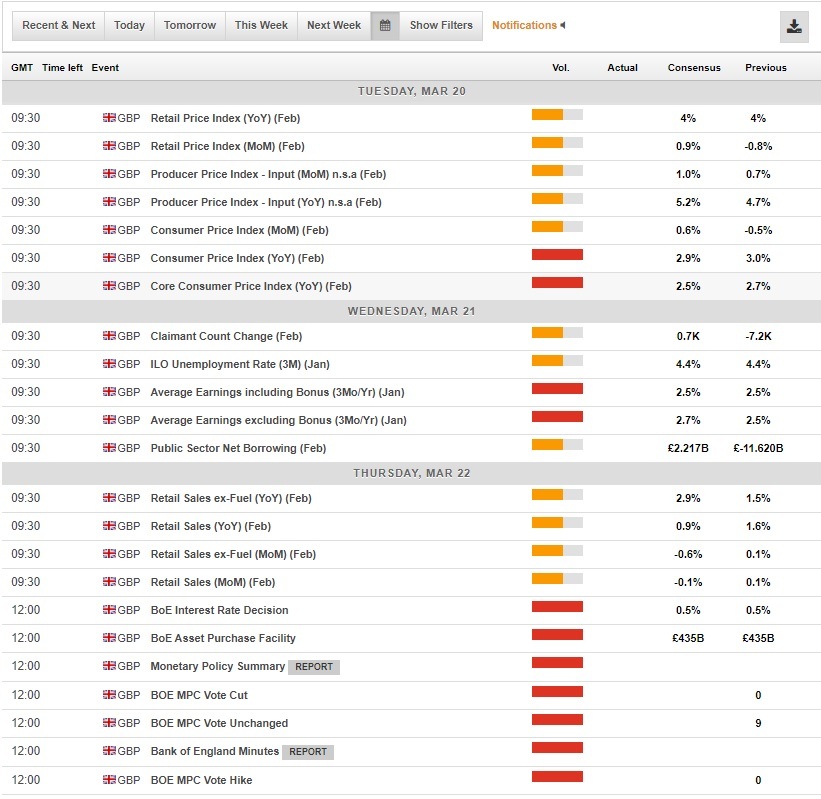
In terms of the economic outlook, Wednesday’s labor market report is even more important, because it will deliver closely watched wage growth data for the 3-months to January period. While claimant count is seen rising neglectable 0.7K and the unemployment rate is expected to remain at 4.4%, near its 4-decade low, the average weekly earnings excluding bonuses are forecast to increase to 2.7% y/y. This is very important, as the nominal wage acceleration is good news for the future of the consumer demand in the UK following the period of negative real, inflation-adjusted wage growth. Any upside surprise is likely to support Sterling, even with the US Federal Reserve seen raising policy rates by 25 basis points later on Wednesday, as the rate hike is already priced-in.
The UK retail sales report is due on the same day as the Bank of England is issuing its monetary policy statement. While total retail sales seen falling -0.1% m/m, the core sales excluding motor fuel sales are expected to fall 0.6% m/m in February. The Bank of England is widely expected to keep the Bank rate unchanged and since the decision is due before the European summit, even the accompanying statement is not likely to indicate any policy bias that would have included the Brexit related news.
The US economic calendar for March 19-23
Technical picture of GBP/USD
The technical picture for the GBP/USD differs on ranging time frames. While the long-term charts including weekly and daily chart analysis point to the upside trend on GBP/USD, short-term charts are less optimistic, favoring short-term downside. With important macro data, central banks meeting and Brexit related European summit all scheduled for the next week, the GBP/USD is tilted to follow important fundamentals rather than technical signals.
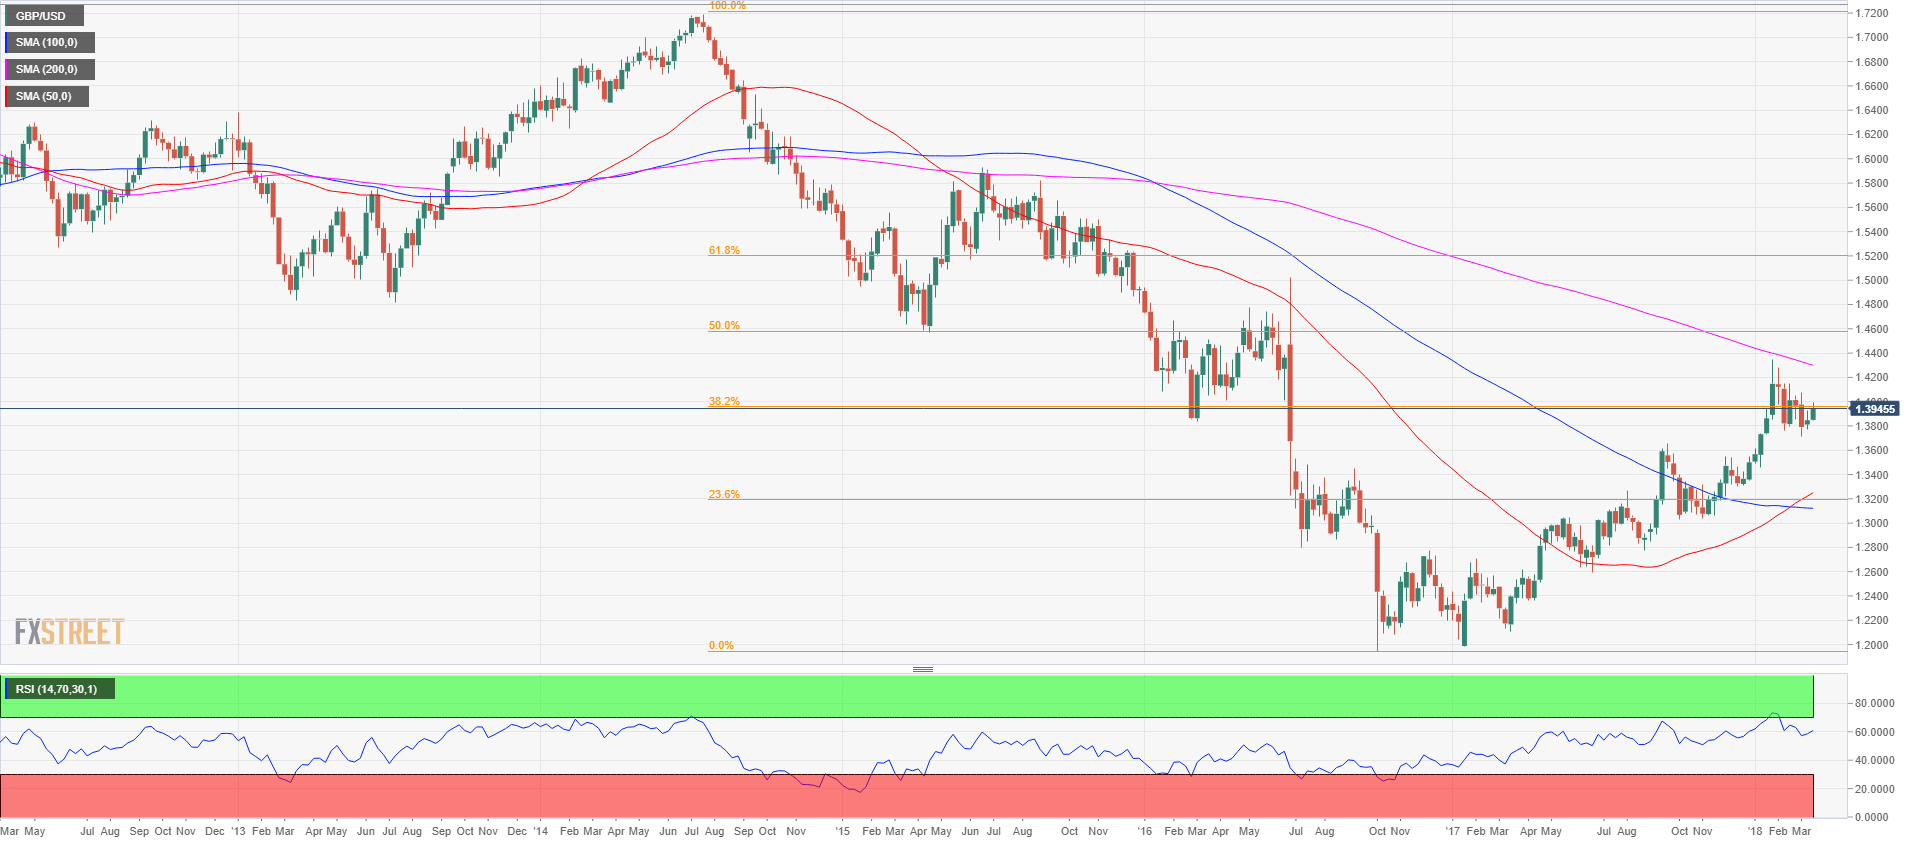
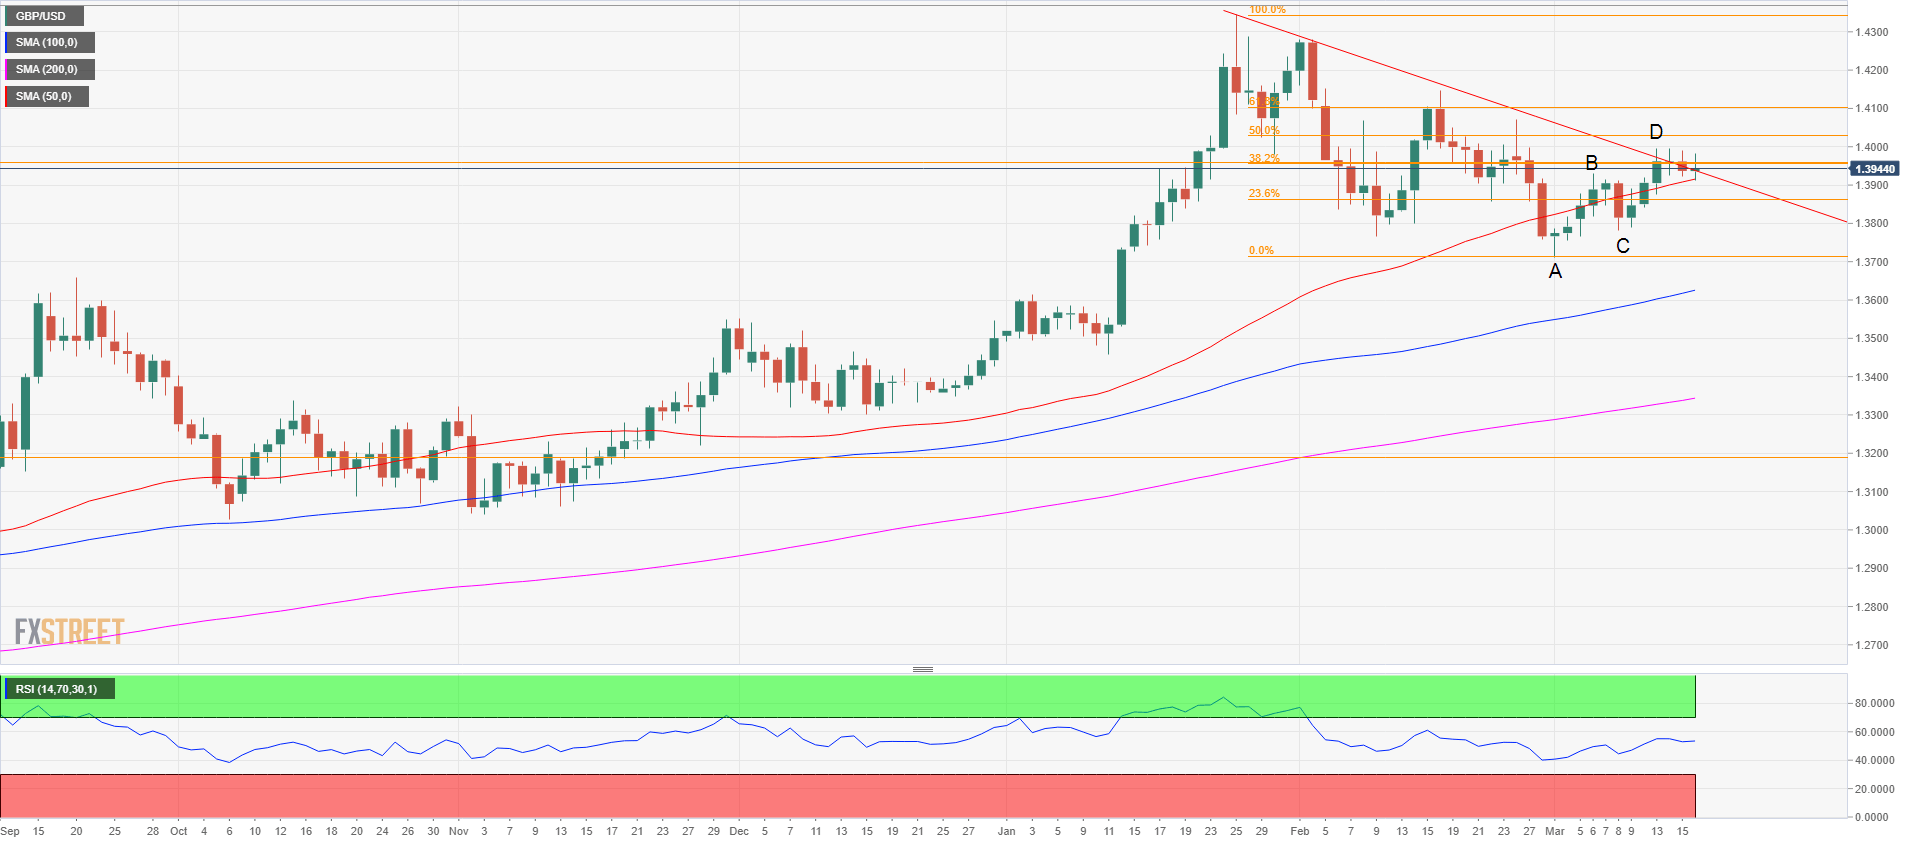
The GBP/USD is still trading within the triangle compression pattern. There is a strong resistance for bulls at 1.3660 level which represents 38.2% Fibonacci retracement from the 2014-2016 downtrend. From a technical point of view, a bullish trend which started in January is still intact, however, bulls will need to break the 1.4000 psychological level if they want to keep the momentum going. The 50-period simple moving average has crossed over the 100-period average to form a so-called golden cross that is considered a very strong bullish signal. If the 1.4000 level can be broken to the upside then the 200-period simple moving average at 1.4300 will likely provide resistance, followed by 1.4600 which is the 50% retracement level from the 2014-2016 downtrend. On the flip side, bears have to break the 1.3720-1.3800 area formed by last cyclical lows to regain traction. Further to the downside 1.3200 is a strong psychological level representing 23.6% Fibonacci retracement together with the 50 and 100-simple moving average.
GBP/USD Weekly chart
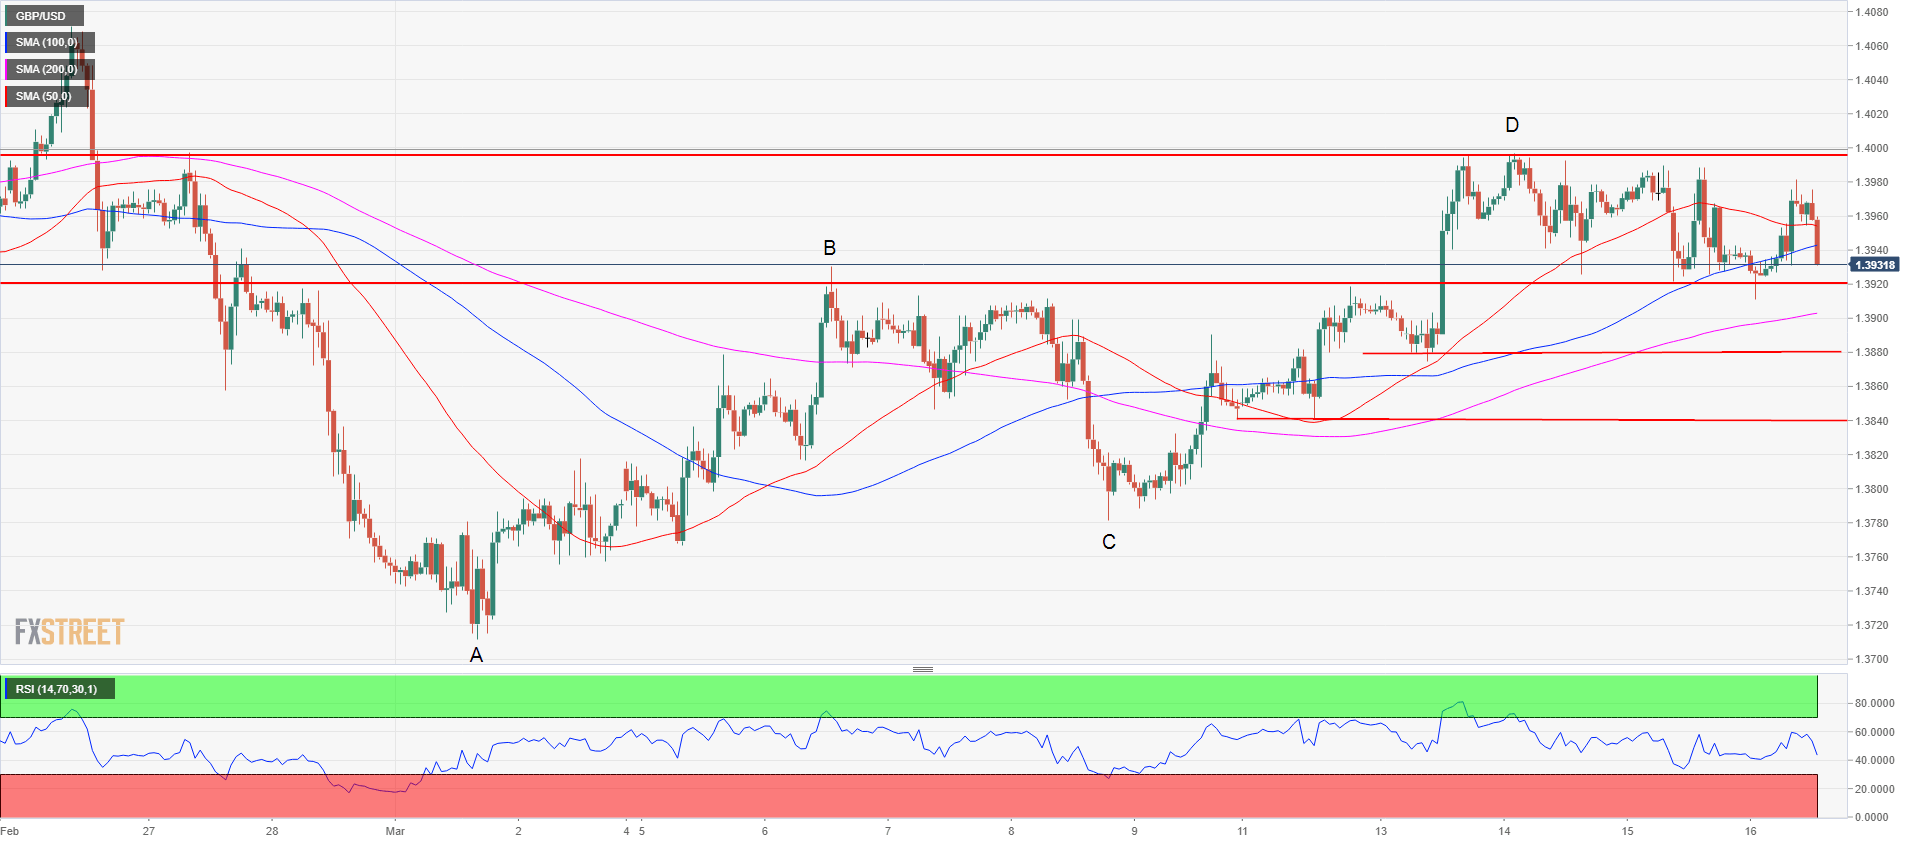
The GBP/USD is trying to find support at the 50-period simple moving average on a daily chart being squeezed between the 50 SMA and the 1.4000 level for last three days. The GBP/USD managed to break above the descending trendline but the bull incursions have all failed so far leaving tails on top of bars. That is suggesting that bulls couldn’t close the bar on the top and after two legs up, the A/B/C/D pattern was formed with market struggling to break 1.4000. A strong breakdown below 1.3900 psychological from last Friday suggests a pullback all the way to 1.3800 ‘B’ point, followed by 1.3700 ‘A’ point which is the start of a two-leg pattern. If bulls manage to get the breakout above 1.4000, then 1.4100 is in the cards with the 61.8% Fibonacci retracement from the December 25-March 1 move lower followed by 1.4300 psychological figure close to the cyclical high.
GBP/USD daily chart
Analysing 1-hour GBP/USD chart suggests that 1.3920 level acting as solid support since March 14, has been broken on Friday with 1.3880 and 1.3840 previous swing lows acting as next support levels followed by 1.3780 ‘B’ point. In case bulls win the resistance levels mentioned in the weekly and daily charts the breakout is likely to be strong while stop/loss orders triggered in support of the bullish trend upwards.
GBP/USD 1-hour chart
Forecast for next week
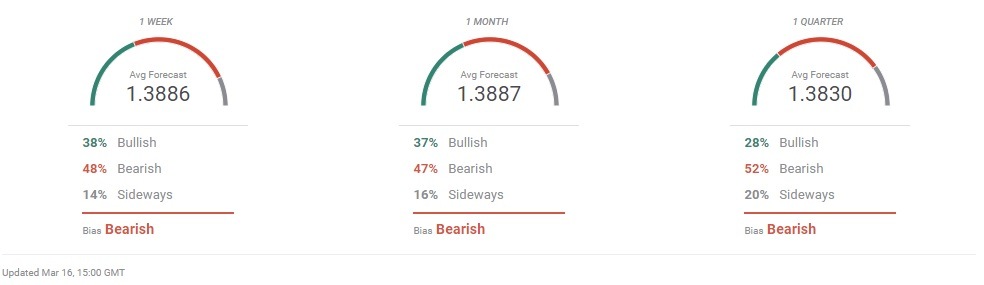
FXStreet Forecast Poll turned overly negative by the end of last week with participating analysts and economists expecting GBP/USD to fall below 1.3800 level. This short-term prediction failed to materialize with the spot ending the eleventh week on 2018 just below 1.3900 level. Bets in the latest FXStreet Forecast Poll are therefore more evenly spread. While last week 81% of participating analysts predicted bearish trend to dominate, now only 48% stick with bearish prediction, while 38% predict the bullish market and 14% sideways market.
On the longer term horizons similarly to 1-week prediction, participating analysts also burned less bearish with only 47% predicting a bearish trend for 1-month ahead and 52% favoring bearish trend in 3-month time from now. This compares to last week's bearish predictions of 63% on the 1-month horizon and 64% on the 3-month horizon. Although bearish trend still dominates, analysts expect a median value of GBP/USD at 1.3887 in 1-month time and 1.3830 in 3-month time from now.
FXStreet Forecast Poll
Note: All information on this page is subject to change. The use of this website constitutes acceptance of our user agreement. Please read our privacy policy and legal disclaimer. Opinions expressed at FXstreet.com are those of the individual authors and do not necessarily represent the opinion of FXstreet.com or its management. Risk Disclosure: Trading foreign exchange on margin carries a high level of risk, and may not be suitable for all investors. The high degree of leverage can work against you as well as for you. Before deciding to invest in foreign exchange you should carefully consider your investment objectives, level of experience, and risk appetite. The possibility exists that you could sustain a loss of some or all of your initial investment and therefore you should not invest money that you cannot afford to lose. You should be aware of all the risks associated with foreign exchange trading, and seek advice from an independent financial advisor if you have any doubts.
Recommended Content
Editors’ Picks
EUR/USD regains traction, recovers above 1.0700

EUR/USD regained its traction and turned positive on the day above 1.0700 in the American session. The US Dollar struggles to preserve its strength after the data from the US showed that the economy grew at a softer pace than expected in Q1.
GBP/USD returns to 1.2500 area in volatile session

GBP/USD reversed its direction and recovered to 1.2500 after falling to the 1.2450 area earlier in the day. Although markets remain risk-averse, the US Dollar struggles to find demand following the disappointing GDP data.
Gold holds around $2,330 after dismal US data

Gold fell below $2,320 in the early American session as US yields shot higher after the data showed a significant increase in the US GDP price deflator in Q1. With safe-haven flows dominating the markets, however, XAU/USD reversed its direction and rose above $2,340.
XRP extends its decline, crypto experts comment on Ripple stablecoin and benefits for XRP Ledger

Ripple extends decline to $0.52 on Thursday, wipes out weekly gains. Crypto expert asks Ripple CTO how the stablecoin will benefit the XRP Ledger and native token XRP.
After the US close, it’s the Tokyo CPI

After the US close, it’s the Tokyo CPI, a reliable indicator of the national number and then the BoJ policy announcement. Tokyo CPI ex food and energy in Japan was a rise to 2.90% in March from 2.50%.