GBP/USD has been bullish on the daily chart. The price after having a bounce has kept producing bullish candles. Yesterday’s candle came out as a bullish candle, which may attract intraday traders to go long and push the price towards the North further. The H4 chart and the H1 chart seem to be getting ready to attract the buyers.
Chart 1 GBP/USD Daily Chart
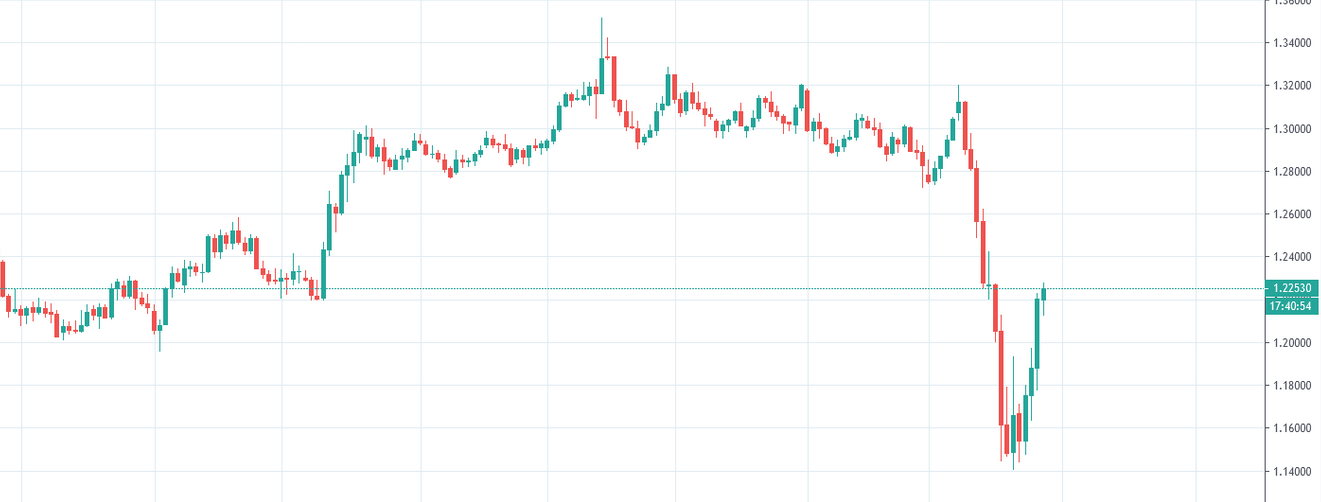
We can see on the daily chart that the price has found its support at 1.14000 zone. It produced two bullish engulfing candles. The first one has a long upper shadow, but the second one looks to be a perfect looking bullish reversal candle. The buyers then kept pushing the price towards the upside. Yesterday's candle came out as a long bullish candle, which set a strong upbeat tone in the intraday charts. The daily traders may wait for the price to consolidate and produce a bullish reversal candle to go long in the pair. The price may find its nearest resistance around the 1.27500 level.
Chart 2 GBP/USD H4 Chart
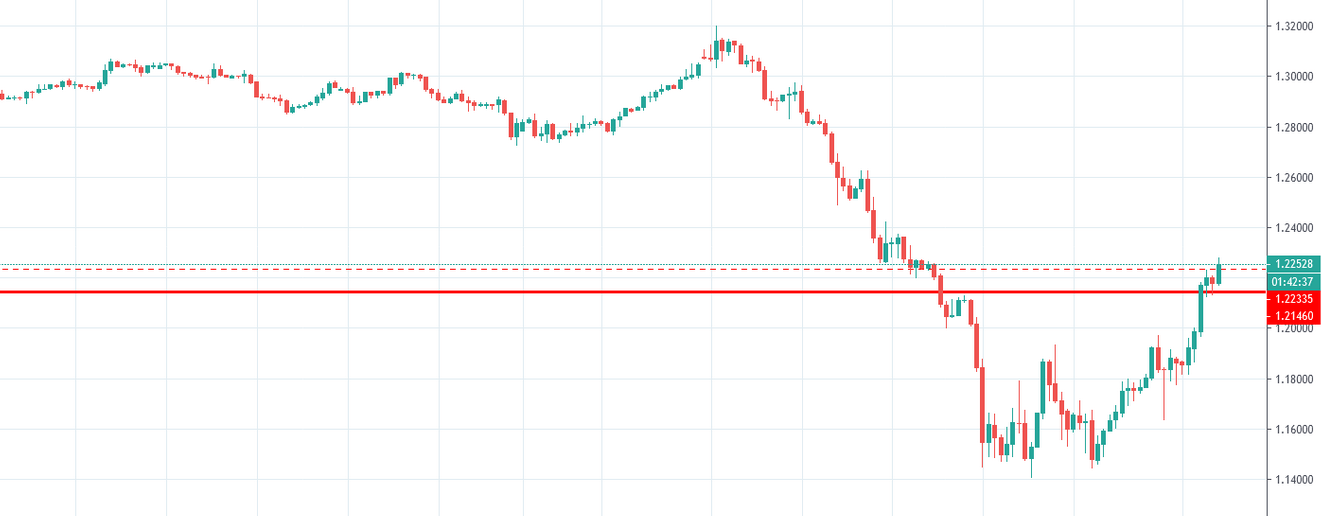
The H4 chart shows that the price produced a double bottom, breached the neckline level, and headed towards the North. The price found its resistance at the level of 1.22335 and created a bearish corrective candle. As of writing, the last candle has been bullish so far. If it comes out as a bullish engulfing candle, the price may head towards the level of 1.24550. In case of a bearish breakout at the consolidation support, the price may get choppy and consolidate within a bigger range.
Chart 3 GBP/USD H1 Chart
The chart shows that the price had a long consolidation and headed towards the level of resistance. One of the candles breached through the level closing above it. The pair is trading above the level now. As of writing, if the last candle comes out as a bullish candle closing above the breakout candle, the buyers may go long on the pair. The price may find its next resistance at the level of 1.22530. If the price comes back within the breakout level, it may consolidate again. The level of 1.21460 may play a vital role in determining its next direction.
The daily is bullish, but the traders may want to wait for a better risk-reward. The H4 and the H1 chart are getting ready to make their next bull run. Considering these three charts, the pair may have another bullish day today.
Risk Warning: CFD and Spot Forex trading both come with a high degree of risk. You must be prepared to sustain a total loss of any funds deposited with us, as well as any additional losses, charges, or other costs we incur in recovering any payment from you. Given the possibility of losing more than your entire investment, speculation in certain investments should only be conducted with risk capital funds that if lost will not significantly affect your personal or institution’s financial well-being. Before deciding to trade the products offered by us, you should carefully consider your objectives, financial situation, needs and level of experience. You should also be aware of all the risks associated with trading on margin.
Recommended Content
Editors’ Picks
AUD/USD hovers around 0.6500 amid light trading, ahead of US GDP

AUD/USD is trading close to 0.6500 in Asian trading on Thursday, lacking a clear directional impetus amid an Anzac Day holiday in Australia. Meanwhile, traders stay cautious due ti risk-aversion and ahead of the key US Q1 GDP release.
USD/JPY finds its highest bids since 1990, near 155.50

USD/JPY keeps breaking into its highest chart territory since June of 1990 early Thursday, testing 155.50 for the first time in 34 years as the Japanese Yen remains vulnerable, despite looming Japanese intervention risks. Focus shifts to Thursday's US GDP report and the BoJ decision on Friday.
Gold price treads water near $2,320, awaits US GDP data

Gold price recovers losses but keeps its range near $2,320 early Thursday. Renewed weakness in the US Dollar and the US Treasury yields allow Gold buyers to breathe a sigh of relief. Gold price stays vulnerable amid Middle East de-escalation, awaiting US Q1 GDP data.
Injective price weakness persists despite over 5.9 million INJ tokens burned
Injective price is trading with a bearish bias, stuck in the lower section of the market range. The bearish outlook abounds despite the network's deflationary efforts to pump the price. Coupled with broader market gloom, INJ token’s doomed days may not be over yet.
Meta Platforms Earnings: META sinks 10% on lower Q2 revenue guidance Premium

This must be "opposites" week. While Doppelganger Tesla rode horrible misses on Tuesday to a double-digit rally, Meta Platforms produced impressive beats above Wall Street consensus after the close on Wednesday, only to watch the share price collapse by nearly 10%.