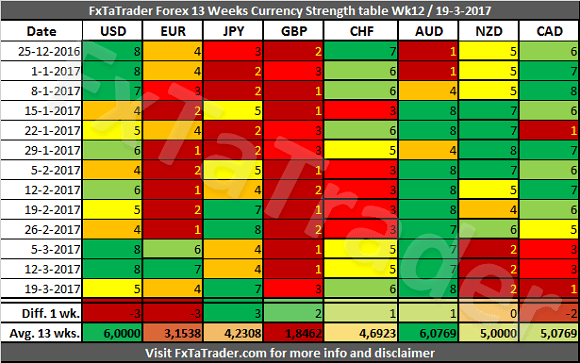
In the Currency Strength table, the AUD was the strongest currency while the CAD was the weakest. There were a lot of changes last week.The JPY gained 3 points while USD and EUR lost 3 points. The GBP gained 2 points and the CAD lost 2. All the other Currencies remained around the level of the previous week with a maximum difference of just 1 point.
______________________________________
13 Weeks Currency Score Strength
The 13 Weeks Currency Strength and the 13 Weeks Average are provided here below. This data and the "13 weeks Currency Classification" are considered for deciding on the preferred range. Because it is not ideal nor desired to change the range for a currency every single week, we perform several checks to avoid this.
1. First of all the strength over a period of the last 13 weeks is considered. See each row for more information.
2. Next, the 13 weeks average is considered, see the last row called "Avg. 13 wks."
3. The number of weeks that a currency was stronger than another currency can also be considered.
4. The Technical Analysis (TA) Charts for each Time Frame could also be consulted.
For analyzing the best pairs to trade looking from a longer-term perspective the last 13 weeks Currency Classification can be used in support.
This was updated on 19 March 2017 and is provided here for reference purposes:
Strong: USD, NZD, AUD, CAD. The preferred range is from 5 to 8.
Neutral: JPY, CHF. The preferred range is from 3 to 4.
Weak: EUR, GBP. The preferred range is from 1 to 2.
When looking at the Average 13 wks. Score the AUD is the strongest of all while the GBP is the weakest. The currencies are grouped together around a level which makes clear to what classification they fit best.
The JPY gained so much strength in the last 7 weeks and is now classified as a neutral currency. The NZD and CAD, on the other hand, are losing a lot of strength in the last 3 weeks. With only being 7 times stronger in the last 13 Weeks than the CHF which is a Neutral currency. These currencies are also having an Average 13 wks. Score close to the CHF and may become a Neutral currency in the coming weeks if they remain this weak.
_____________________________________
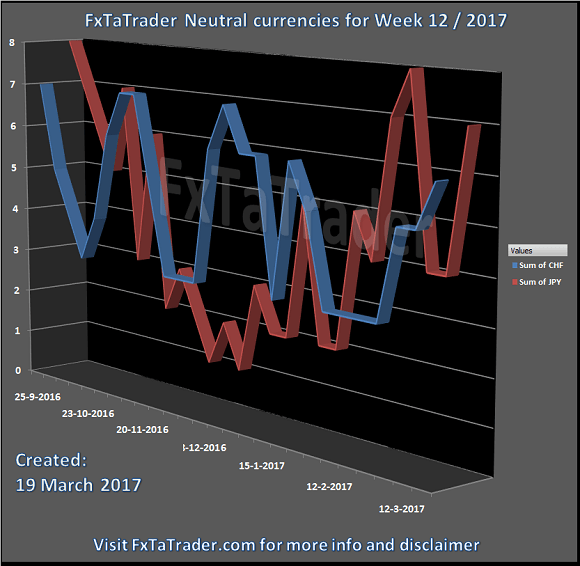
Classification review
The JPY gained a lot of strength lately and as can be seen in the chart below the currency bottomed in December last year. In February and March the JPY had Scores in the range of the Strong currencies. For now this currency is classified as a Neutral currency. The CHF is clearly for a long time a Neutral currency with sometimes a small dip or top. Below you can see the Weekly Currency Score Chart with the 6 months data as a reference.
_____________________________________
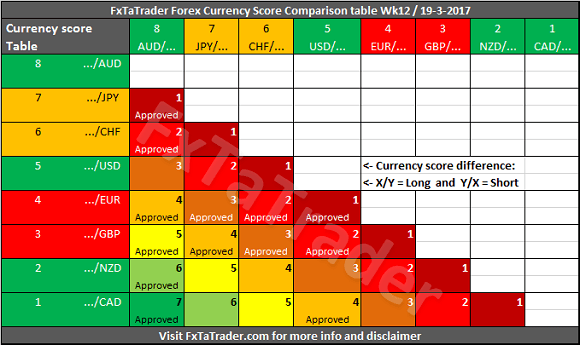
Currency Score Comparison
"Comparison table" and the "Ranking and Rating list"
The Forex Currency Comparison Table compares each currency with its counterpart based on the Currency Score. For more information about the currency Score of this week, you can read the article "Forex Ranking, Rating and Score" which is published every week together with this article.
By using the comparison table directly below you can get a view without the volatility and statistics as opposed to the "Ranking and Rating list". Only the strength of each currency against the counterparts is analyzed by using the Technical analysis charts of the 4 Time Frames that are also used for the "Ranking and Rating List".
The information from the Comparison Table is the source for calculating the "Ranking and Rating List" where this list additionally uses the volatility and statistics for creating the best and worst performer in the list from number 1 to 28.
"Comparison table" and the "Currency Score Chart"
The additional value of this table compared to the Currency Score table is that the Comparison Table compares the strength between the currencies of each pair. By subtracting the strength of the weaker currency from the stronger currency we have a way to compare each pair combination.
The comparison table provides a way to compare currencies from a longer term perspective of 13 weeks and also simultaneously taking the current trend into account. By coloring the currencies in the X and Y axis according to their Classification we can show what the best combinations are. In doing this we apply 2 rules to make it clearer.
1. First of all only better-classified currencies in combination with weaker classified currencies are "Approved" when there is a Currency Score difference of at least 1 in the current week.
2. The only exception is when 2 currencies are similarly classified but the Currency Score difference is equal to or more than 4.
3. It means that each currency should be as far apart from each other as possible in the range from 1 to 8. The classification of the currencies in question may change in the longer term. By using the difference of 4 which is exact at the half of the range it seems a safe approach for trading 2 currencies which are similarly classified.
4. Even though currencies may be in the same classification a currency may be in a weaker/stronger period and may even change its classification in the future. See the current classification for the coming period at the beginning of this article.
______________________________________
Putting the pieces together
Based on the last "13 Weeks currency classification" and the "Currency Comparison Table" the most interesting currencies for going long seem to be the:
AUD, JPY and CHF.
These are Strong or Neutral currencies from a longer term perspective when looking at the last "13 Weeks currency classification".
For going short the same analysis can be done and the following currencies seem to fit best:
GBP.
These are Weak or Neutral currencies from a longer term perspective.
Currencies with a high deviation seem less interesting to trade because they are less predictable. A good example at the moment is/are e.g. the:
JPY, CAD, NZD and EUR.
Some of the pairs in the "Currency Comparison Table" comply for a longer term trade based on the Technical Analysis (TA) of the Daily and Weekly chart. For the coming week, these seem to be: AUD/CAD, GBP/AUD, AUD/NZD, EUR/AUD and GBP/JPY.
The articles are my personal opinion, not recommendations, FX trading is risky and not suitable for everyone.The content is for educational purposes only and is aimed solely for the use by ‘experienced’ traders in the FOREX market as the contents are intended to be understood by professional users who are fully aware of the inherent risks in forex trading. The content is for 'Forex Trading Journal' purpose only. Nothing should be construed as recommendation to purchase any financial instruments. The choice and risk is always yours. Thank you.
Recommended Content
Editors’ Picks
EUR/USD extends gains above 1.0700, focus on key US data

EUR/USD meets fresh demand and rises toward 1.0750 in the European session on Thursday. Renewed US Dollar weakness offsets the risk-off market environment, supporting the pair ahead of the key US GDP and PCE inflation data.
GBP/USD extends recovery above 1.2500, awaits US GDP data

GBP/USD is catching a fresh bid wave, rising above 1.2500 in European trading on Thursday. The US Dollar resumes its corrective downside, as traders resort to repositioning ahead of the high-impact US advance GDP data for the first quarter.
Gold price edges higher amid weaker USD and softer risk tone, focus remains on US GDP

Gold price (XAU/USD) attracts some dip-buying in the vicinity of the $2,300 mark on Thursday and for now, seems to have snapped a three-day losing streak, though the upside potential seems limited.
Injective price weakness persists despite over 5.9 million INJ tokens burned
Injective price is trading with a bearish bias, stuck in the lower section of the market range. The bearish outlook abounds despite the network's deflationary efforts to pump the price.
US Q1 GDP Preview: Economic growth set to remain firm in, albeit easing from Q4

The United States Gross Domestic Product (GDP) is seen expanding at an annualized rate of 2.5% in Q1. The current resilience of the US economy bolsters the case for a soft landing.