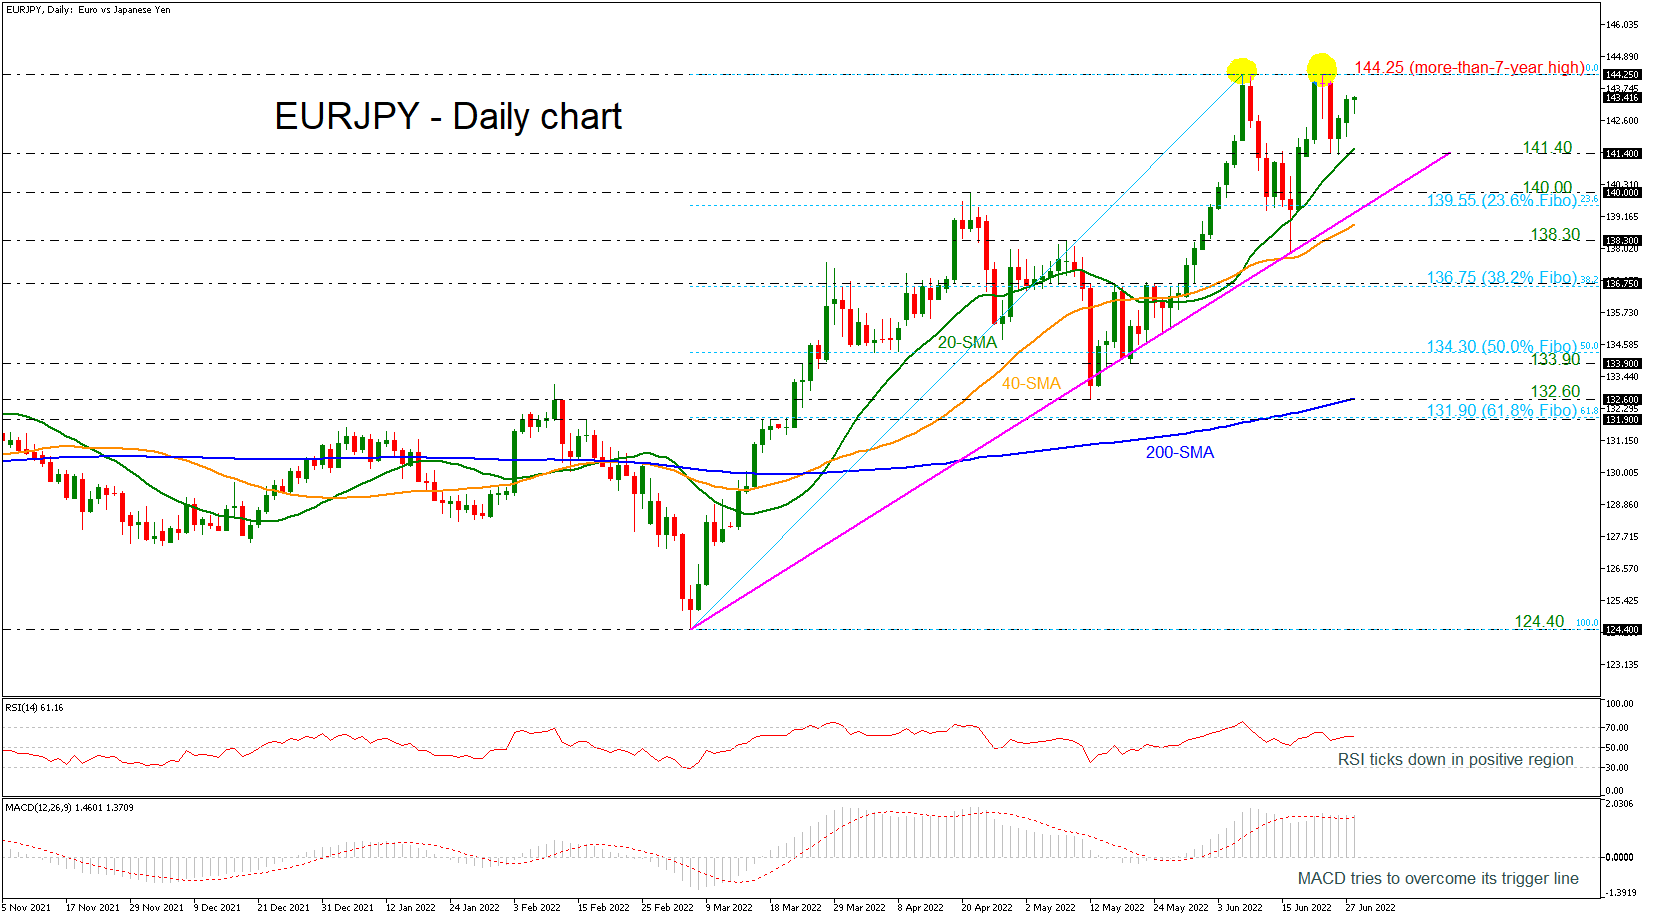
EUR/JPY posts double top near 7-year high
EURJPY has posted a double top around the more-than-seven-year high of 144.25 over the last couple of weeks. The MACD oscillator is extending its positive momentum above its trigger and zero lines; however, the RSI indicator is pointing slightly lower in the positive region. The 20- and 40-day simple moving averages (SMAs) are still developing above the bullish crossover, suggesting that the bull market is still on the cards.
On the upside, resistance could occur around the multi-year high of 144.25 that may be a strong resistance level for traders. Higher still, the peak from December 2014 at 149.75 would increasingly come into scope.
A reversal to the downside could stall at the latest bottom at 141.40, which overlaps with the 20-day SMA ahead of the medium-term ascending trend line near the 140.00 round number. Further below, the 23.6% Fibonacci retracement level of the upward movement from 124.40 to 144.25 at 139.55 could also provide support, while any violation at this point could potentially trigger further sell-off in the market, probably leading the price down to 138.30.
The medium-term picture continues to look predominantly bullish, with trading activity taking place above the 200-day SMA.
Overall, EURJPY has been completing a double top formation and any declines below the 138.30 support may shift the outlook to bearish.
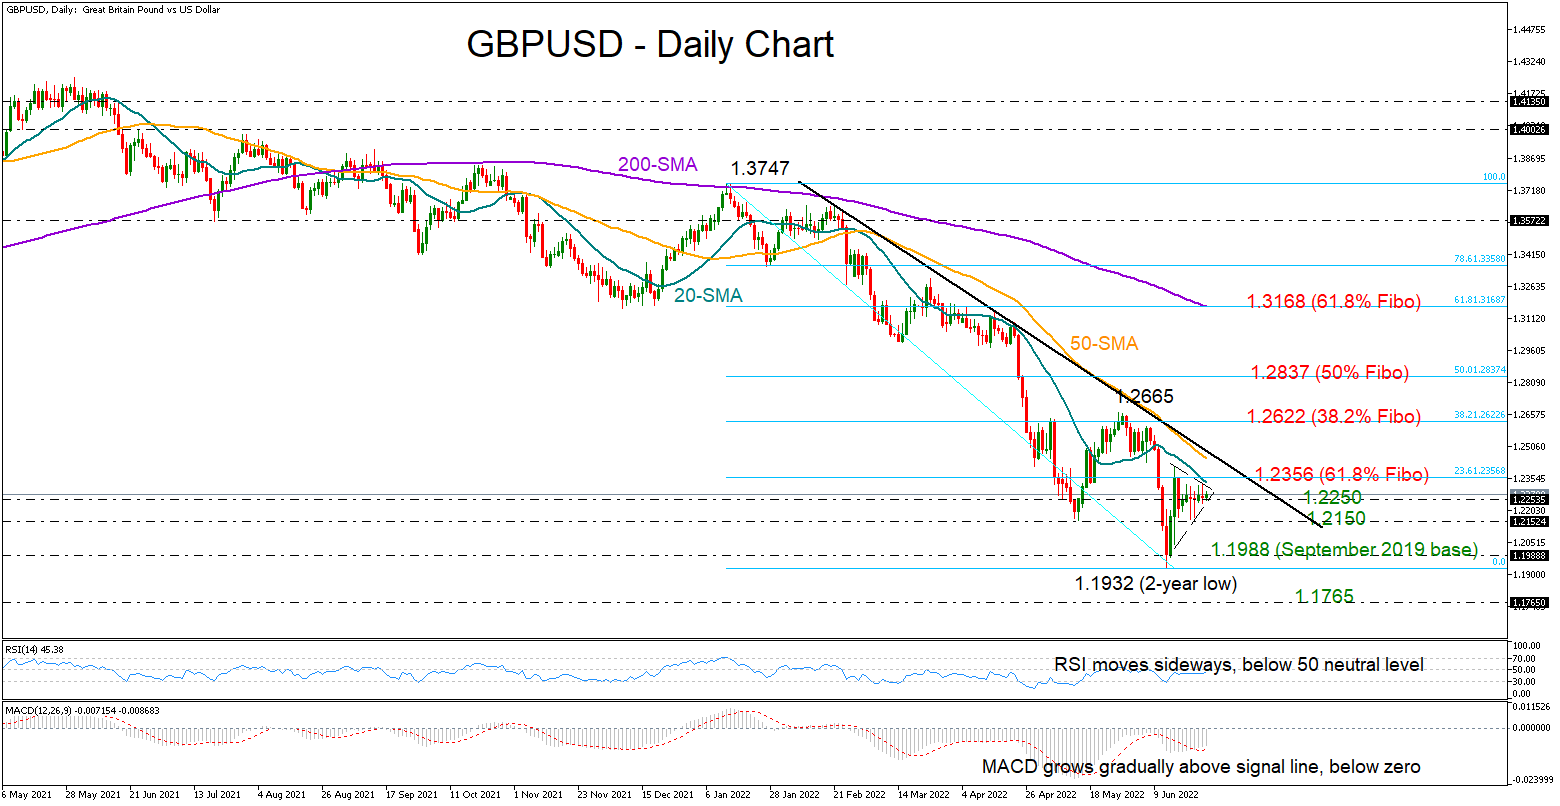
GBP/USD in wait-and-see mode within downtrend
GBPUSD has been tip toeing sideways over the past week within the range of 1.2150 – 1.2356, unable to extend its recovery off two-year lows.
The momentum indicators are reflecting a neutral bias as the latest rebound in the RSI has stalled marginally below its 50 neutral mark, while the MACD continues to grow gradually within the negative region and barely above its red signal line.
As regards the market trend though, the picture remains bearish given the lower lows and lower highs formed below the descending trendline. The falling simple moving averages (SMA) are also promoting the negative direction in the market.
A close above the 20-day simple moving average (SMA) and the 23.6% Fibonacci retracement of the 1.3747 – 1.1932 downtrend at 1.2356 could immediately pause around the descending trendline at 1.2465. The 50-day SMA is positioned in the same area. Therefore, another bullish break at this point could confirm an extension towards the 38.2% Fibonacci of 1.2622, where June’s peak is also placed. Should upside pressures accelerate from here, violating the negative trend pattern, the spotlight will shift up to the 50% Fibonacci of 1.2837.
Looking for support levels, the 1.2250 region has been cooling downside forces over the past week. Should that floor collapse, the 1.2150 restrictive region may come to the rescue, preventing a continuation towards the crucial zone of 1.1988 – 1.1932. In case the downtrend resumes below the latter, a new lower low could be formed around 1.1765, taken from March 2020.
In the four-hour chart, the pair keeps trading within a triangle for the second consecutive week.
In summary, GBPUSD is holding a neutral-to-bearish status in the short-term picture. Failure to bounce above 1.2356, and more importantly beyond 1.2465, may shift attention back to the downside.
Forex trading and trading in other leveraged products involves a significant level of risk and is not suitable for all investors.
Recommended Content
Editors’ Picks
AUD/USD failed just ahead of the 200-day SMA

Finally, AUD/USD managed to break above the 0.6500 barrier on Wednesday, extending the weekly recovery, although its advance faltered just ahead of the 0.6530 region, where the key 200-day SMA sits.
EUR/USD met some decent resistance above 1.0700

EUR/USD remained unable to gather extra upside traction and surpass the 1.0700 hurdle in a convincing fashion on Wednesday, instead giving away part of the weekly gains against the backdrop of a decent bounce in the Dollar.
Gold stays firm amid higher US yields as traders await US GDP data

Gold recovers from recent losses, buoyed by market interest despite a stronger US Dollar and higher US Treasury yields. De-escalation of Middle East tensions contributed to increased market stability, denting the appetite for Gold buying.
Ethereum suffers slight pullback, Hong Kong spot ETH ETFs to begin trading on April 30

Ethereum suffered a brief decline on Wednesday afternoon despite increased accumulation from whales. This follows Ethereum restaking protocol Renzo restaked ETH crashing from its 1:1 peg with ETH and increased activities surrounding spot Ethereum ETFs.
Dow Jones Industrial Average hesitates on Wednesday as markets wait for key US data

The DJIA stumbled on Wednesday, falling from recent highs near 38,550.00 as investors ease off of Tuesday’s risk appetite. The index recovered as US data continues to vex financial markets that remain overwhelmingly focused on rate cuts from the US Fed.