![]() Lara Iriarte, CMT
Lara Iriarte, CMT
Elliott Wave Gold
ELLIOTT WAVE ANALYSIS
MONTHLY CHART
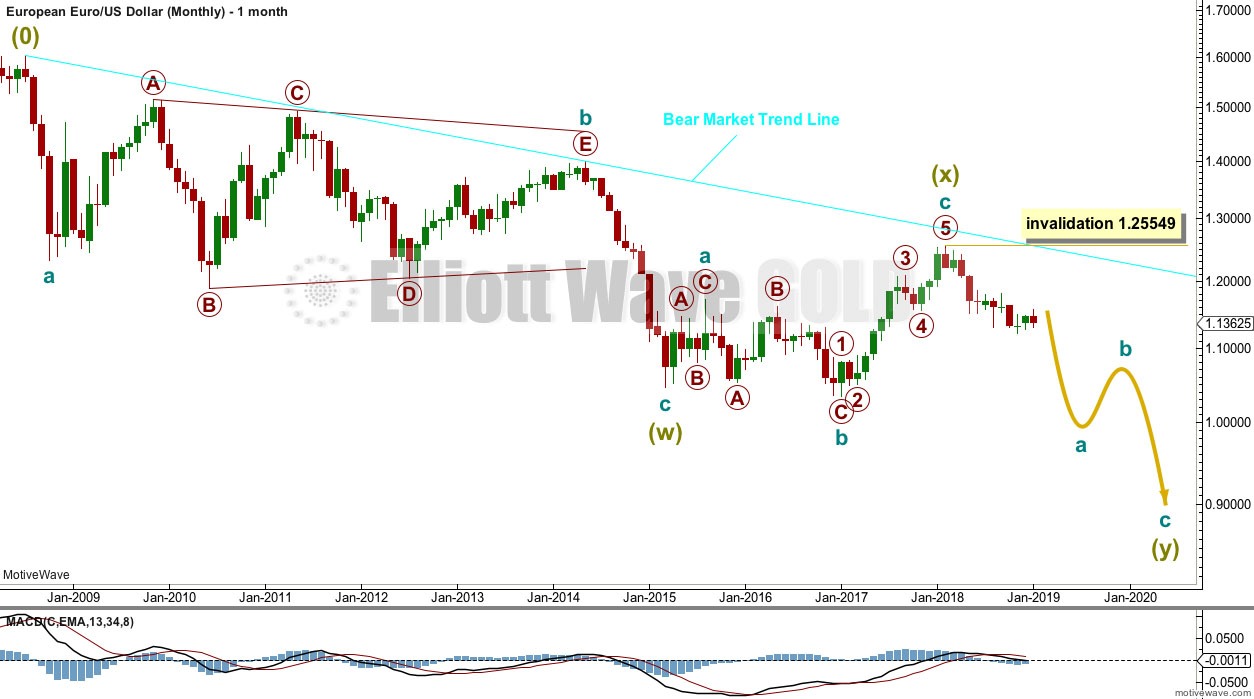
The (0) is from where the wave count begins.
A large zigzag can be seen complete at the low in March 2015. This is labelled Super Cycle wave (w).
A low now below this point indicates that the larger structure downwards is incomplete. The Elliott wave structure that fits best here is a double zigzag.
The first zigzag in the double is complete; it is labelled Super Cycle wave (w). The double is now joined by a complete three in the opposite direction, an expanded flat labelled Super Cycle wave (x). Because Super Cycle wave (x) ends just short of the cyan bear market trend line, it looks like it is over there.
Super Cycle wave (y) is most likely now to unfold as a zigzag.
While double zigzags and double combinations are labelled the same, W-X-Y, they are very different structures.
Double zigzags, like single zigzags, normally have a strong counter trend slope. To achieve this their X waves are usually brief and shallow. The second zigzag in the double usually moves reasonably beyond the end of the first zigzag, so that the whole structure has a strong slope.
Double combinations are sideways movements. To achieve a sideways look their X waves are usually deep and can also often be time consuming. The second structure in the double usually ends about the same level as the first, so that the whole structure takes up time and moves price sideways.
Here, Super Cycle wave (x) is relatively shallow. This indicates a double zigzag is most likely unfolding lower.
The bear market trend line may be expected to continue to provide resistance while the bear market for EURUSD remains intact.
The strongest piece of technical analysis on this chart is the cyan trend line. The fact that it was tested and recently held in February 2018 indicates this line has strength. Any strong bounces within the ongoing bear market may be expected to find strong resistance at this trend line.
WEEKLY CHART
Primary wave 1 subdivides as an impulse.
Primary wave 2 may be unfolding as an expanded flat correction. Within primary wave 2, intermediate waves (A) and (B) both subdivide as a zigzags. Intermediate wave (C) should subdivide as a five wave structure.
The most common Fibonacci ratio is used to calculate a target at intermediate degree for intermediate wave (C) to end. This is very close to the 0.618 Fibonacci ratio of primary wave 1.
2 of 6 21/01/19, 11:26 AM If primary wave 2 moves above the target or is long lasting enough, it should find strong resistance at the cyan trend line that is copied over from the monthly chart.
MAIN DAILY CHART

This daily chart focusses on the structure of primary wave 2.
This wave count considers intermediate wave (C) as an incomplete impulse. Within intermediate wave (C), minor wave 2 may be a combination with minute W subdividing as a zigzag and minute Y subdividing as an expanded flat. Minor wave 3 is incomplete and needs to subdivide as an impulse to meet Elliott Wave rules.
Minuette wave (ii) may not move beyond the start of minuette wave (i) below 1.13093.
ALTERNATE DAILY CHART
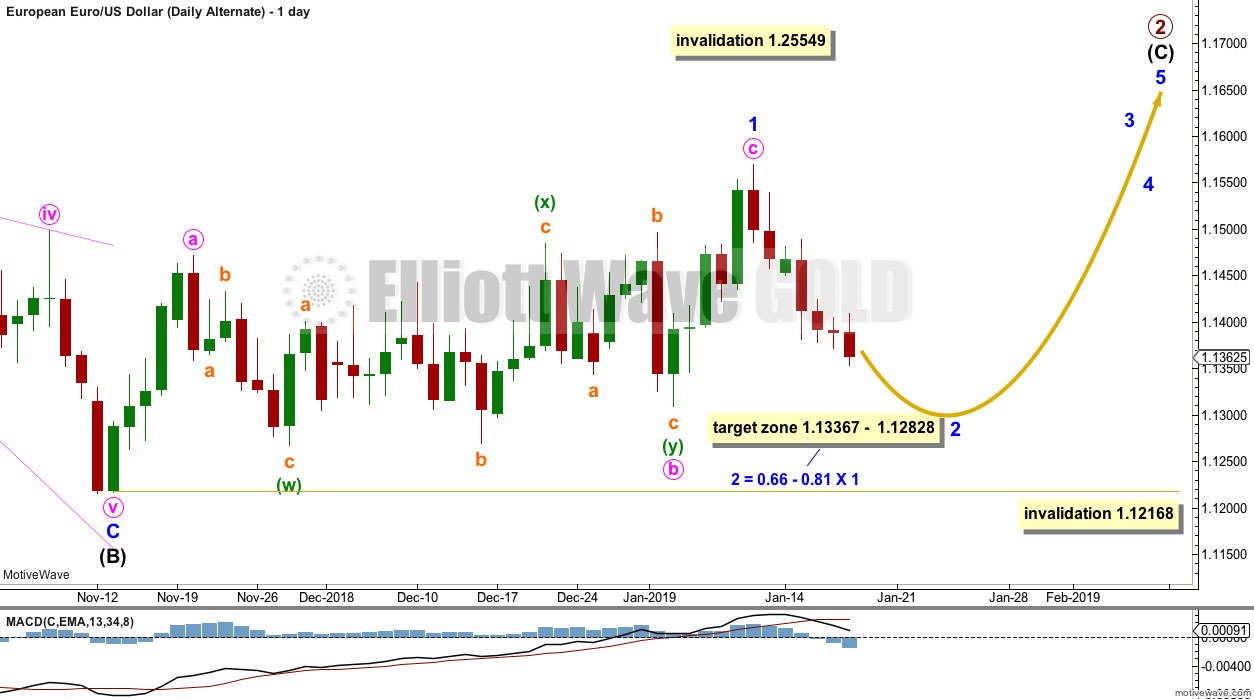
This alternate wave count considers intermediate wave (C) as an incomplete ending diagonal.
All sub waves within an ending diagonal should subdivide as zigzags. A zigzag for minor wave 1 may be complete at the last high of 1.5695.
Using the Elliott Wave guideline, wave 2 of a diagonal most commonly retraces 0.66 to 0.81 of the preceding wave, a target zone between 1.3367 and 1.2828 may be calculated.
WEEKLY TECHNICAL ANALYSIS
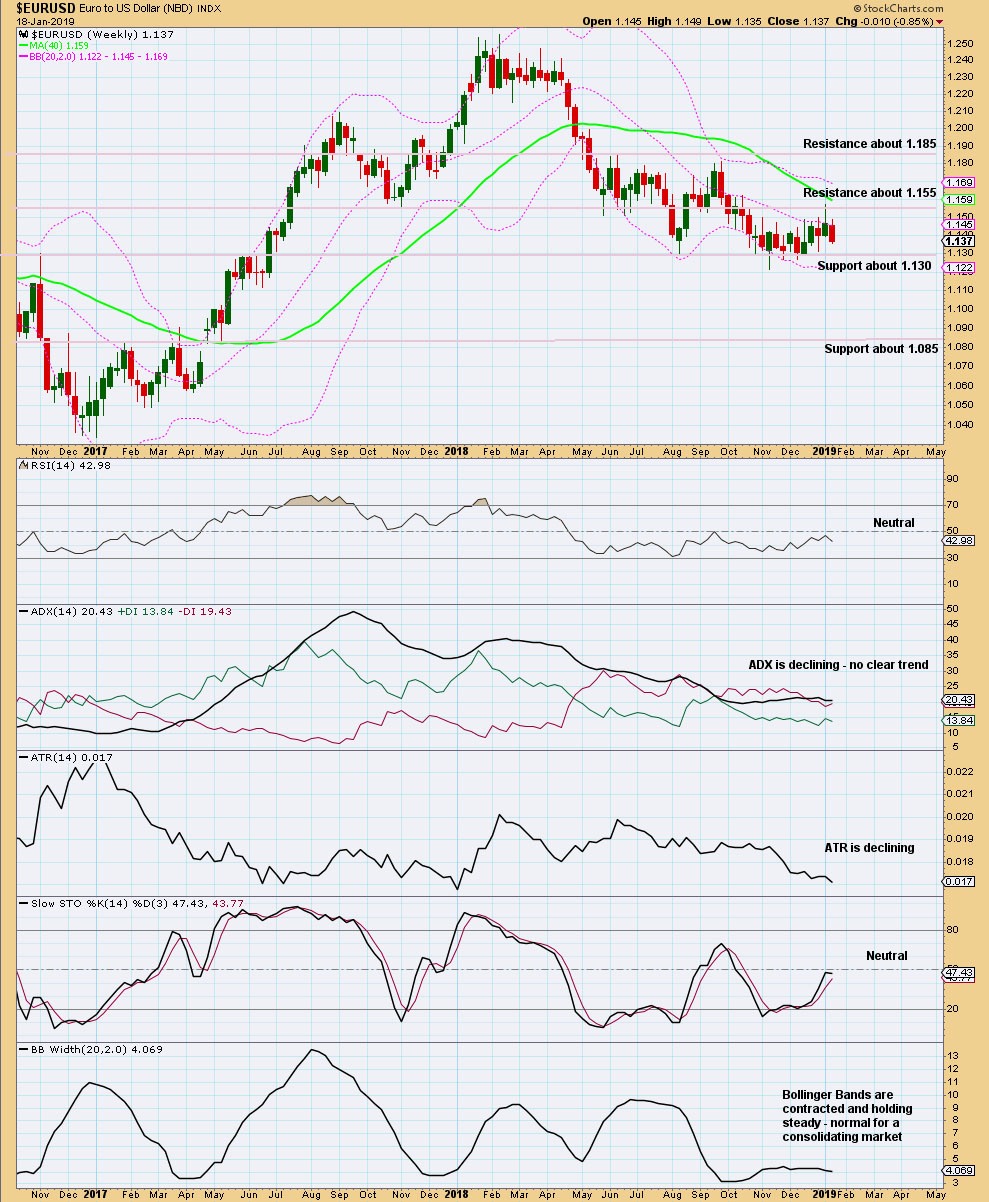
Price is currently range bound and swinging from resistance at about 1.155 to support at about 1.130. ADX supports the view that the market is consolidating. A break out above resistance or support is needed to indicate a new trend.
DAILY TECHNICAL ANALYSIS
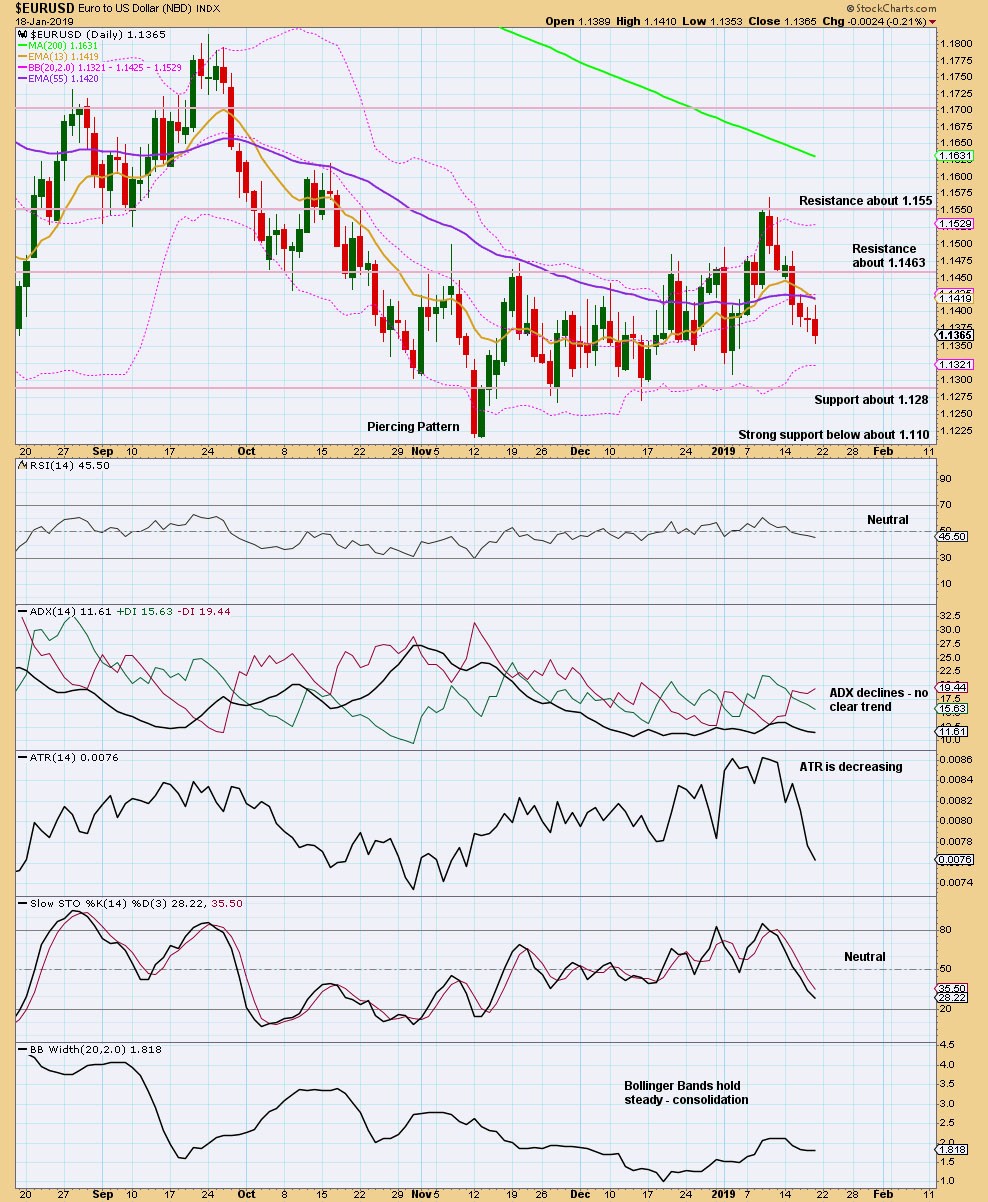
Price is falling with declining volume and ATR, which shows weakness in the downwards movement. This supports the main Elliott Wave count.
Expect price to move lower to support. During a consolidating market, support or resistance may be overshot only for price to then turn around and return to within the consolidation zone.
When price reaches support and Stochastics is oversold, then a downwards swing may be complete. Do not expect price to move in a straight line.
VOLUME ANALYSIS

Price is falling of its own weight. On Balance Volume has broken below support, which is a bearish signal. This may be a small indication that price will continue to move downwards, which offers some support for the alternative Elliott Wave count.
Our service is educational, we aim to teach you how to learn to perform your own Elliott wave analysis.
Recommended Content
Editors’ Picks
USD/JPY holds near 155.50 after Tokyo CPI inflation eases more than expected

USD/JPY is trading tightly just below the 156.00 handle, hugging multi-year highs as the Yen continues to deflate. The pair is trading into 30-plus year highs, and bullish momentum is targeting all-time record bids beyond 160.00, a price level the pair hasn’t reached since 1990.
AUD/USD stands firm above 0.6500 with markets bracing for Aussie PPI, US inflation

The Aussie Dollar begins Friday’s Asian session on the right foot against the Greenback after posting gains of 0.33% on Thursday. The AUD/USD advance was sponsored by a United States report showing the economy is growing below estimates while inflation picked up.
Gold soars as US economic woes and inflation fears grip investors

Gold prices advanced modestly during Thursday’s North American session, gaining more than 0.5% following the release of crucial economic data from the United States. GDP figures for the first quarter of 2024 missed estimates, increasing speculation that the US Fed could lower borrowing costs.
Ethereum could remain inside key range as Consensys sues SEC over ETH security status

Ethereum appears to have returned to its consolidating move on Thursday, canceling rally expectations. This comes after Consensys filed a lawsuit against the US SEC and insider sources informing Reuters of the unlikelihood of a spot ETH ETF approval in May.
Bank of Japan expected to keep interest rates on hold after landmark hike

The Bank of Japan is set to leave its short-term rate target unchanged in the range between 0% and 0.1% on Friday, following the conclusion of its two-day monetary policy review meeting for April. The BoJ will announce its decision on Friday at around 3:00 GMT.