EUR/CHF produced a bullish engulfing candle yesterday after being bearish for a long time on the daily chart. The daily traders are to wait for the price to consolidate and produce another bullish daily candle to offer them entry. However, the H4 and the H1 traders may keep an eye to go long on the pair.
Chart 1 EUR/CHF Daily Chart
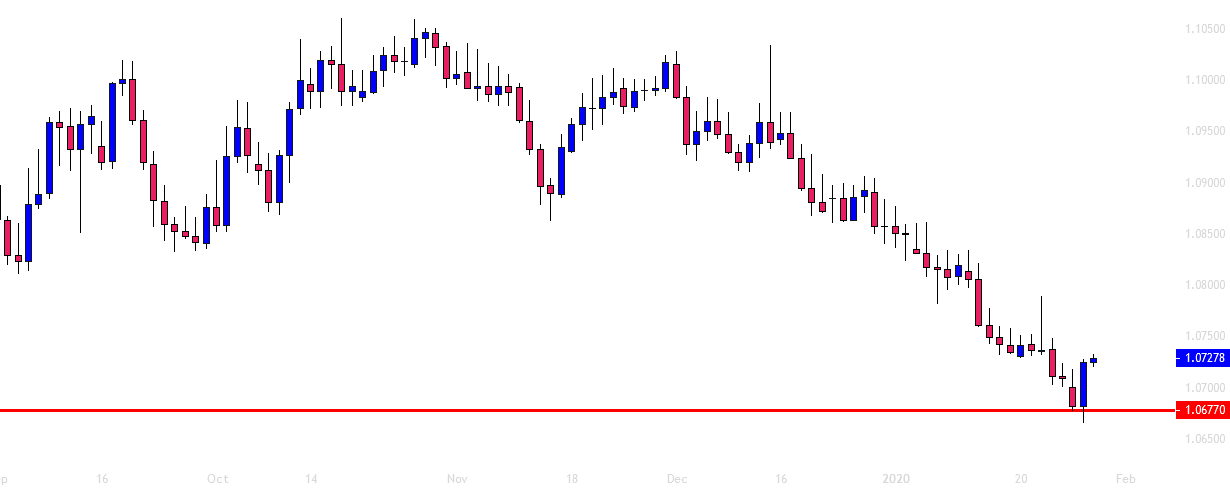
The chart shows that it made a long bearish move. The level of 1.06770 held the price and produced a bullish engulfing candle. Thus, the sellers are to wait for the chart to create a bearish reversal candle and a breakout at the level of 1.06770 to go short again on the pair. The buyers are to wait for the price to consolidate and a bullish reversal candle along with a bullish breakout to go long on the pair. Meanwhile, the buyers on the H4 chart may find opportunities to go long on the pair.
Chart 2 EUR/CHF H4 Chart
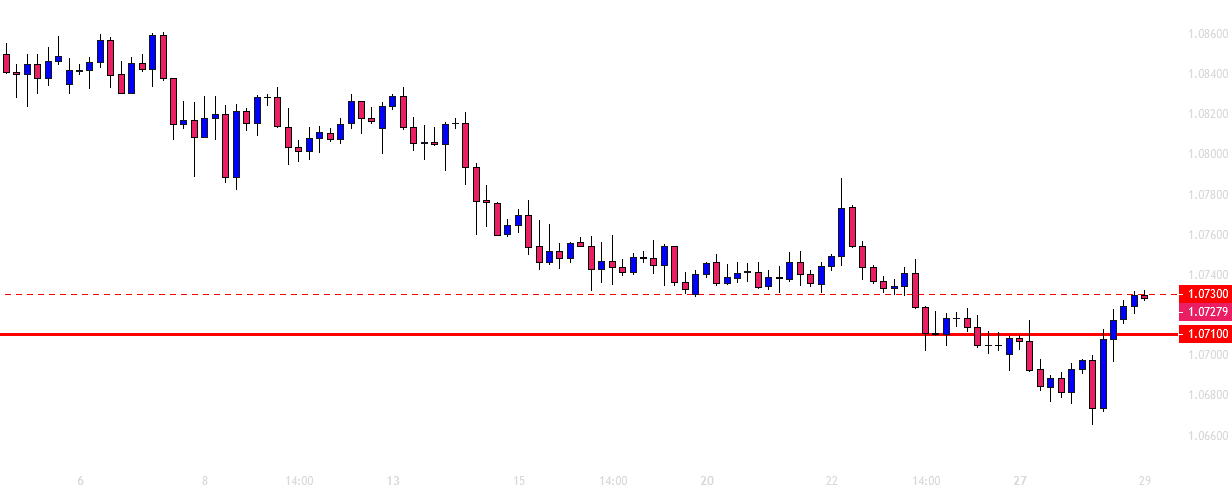
The chart shows that the price has been heading towards the North upon producing a bullish engulfing candle. The level of 1.07100 may work as a level of resistance. The level of 1.07100 may hold the price as support. If the price consolidates between these two levels and makes a bullish breakout upon producing an H4 bullish reversal candle, the buyers may push the price towards the North further. It may find its next resistance at the level of 1.07570. On the other hand, if the price makes a bearish breakout at the level of 1.07100, it may get choppy for a while on the H4 chart.
Chart 3 EUR/CHF H1 Chart
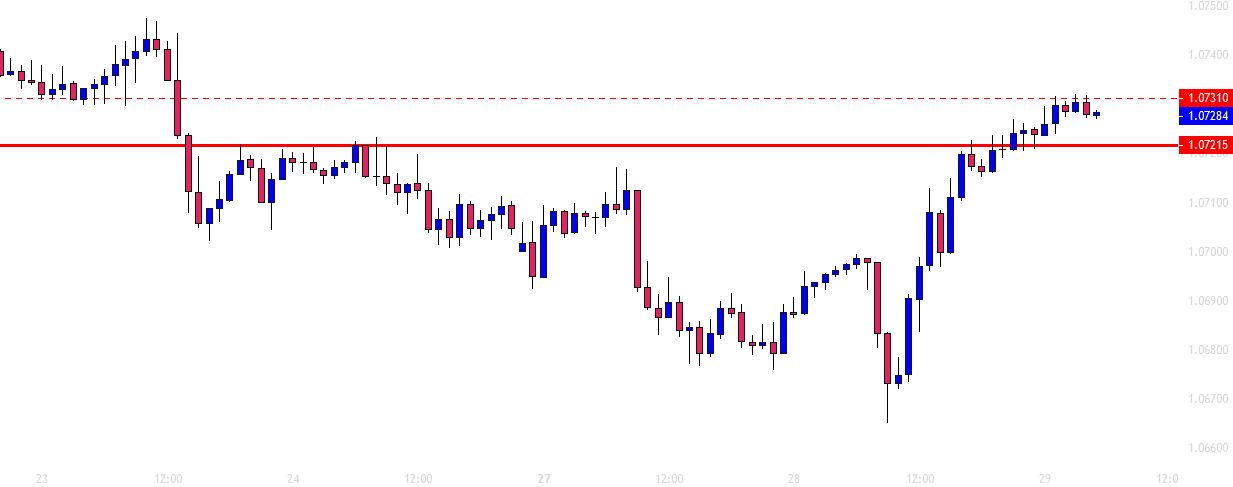
The chart shows that the price produced a morning start and headed towards the North with good bullish momentum. On its way, it consolidated and continued its bullish journey on several occasions. It seems that the price may have found its resistance at the level of 1.07310. The level of 1.07215 may work as a level of support. A bullish reversal candle around the support followed by a breakout at the level of resistance may attract the buyers to push the price towards the North as well. The price may find its next resistance at the level of 1.07465.
The daily chart produced a strong bullish reversal candle, but the bear still holds the key. On the other hand, the H4 and the H1 chart look bullish biased. These two charts may change the equation on the daily chart. Considering these three charts, it seems it is going to be a good battle between the daily sellers versus major intraday charts’ buyers.
Risk Warning: CFD and Spot Forex trading both come with a high degree of risk. You must be prepared to sustain a total loss of any funds deposited with us, as well as any additional losses, charges, or other costs we incur in recovering any payment from you. Given the possibility of losing more than your entire investment, speculation in certain investments should only be conducted with risk capital funds that if lost will not significantly affect your personal or institution’s financial well-being. Before deciding to trade the products offered by us, you should carefully consider your objectives, financial situation, needs and level of experience. You should also be aware of all the risks associated with trading on margin.
Recommended Content
Editors’ Picks
AUD/USD could extend the recovery to 0.6500 and above

The enhanced risk appetite and the weakening of the Greenback enabled AUD/USD to build on the promising start to the week and trade closer to the key barrier at 0.6500 the figure ahead of key inflation figures in Australia.
EUR/USD now refocuses on the 200-day SMA

EUR/USD extended its positive momentum and rose above the 1.0700 yardstick, driven by the intense PMI-led retracement in the US Dollar as well as a prevailing risk-friendly environment in the FX universe.
Gold struggles around $2,325 despite broad US Dollar’s weakness

Gold reversed its direction and rose to the $2,320 area, erasing a large portion of its daily losses in the process. The benchmark 10-year US Treasury bond yield stays in the red below 4.6% following the weak US PMI data and supports XAU/USD.
Bitcoin price makes run for previous cycle highs as Morgan Stanley pushes BTC ETF exposure

Bitcoin (BTC) price strength continues to grow, three days after the fourth halving. Optimism continues to abound in the market as Bitcoiners envision a reclamation of previous cycle highs.
US versus the Eurozone: Inflation divergence causes monetary desynchronization

Historically there is a very close correlation between changes in US Treasury yields and German Bund yields. This is relevant at the current juncture, considering that the recent hawkish twist in the tone of the Federal Reserve might continue to push US long-term interest rates higher and put upward pressure on bond yields in the Eurozone.