![]() Nick Mastrandrea
Nick Mastrandrea
Market Tea Leaves
Good Morning Traders,
As of this writing 4:20 AM EST, here’s what we see:
US Dollar: Dec. USD is Down at 97.680.
Energies: December Crude is Up at 50.85.
Financials: The Dec 30 year bond is Down 1 tick and trading at 163.29.
Indices: The December S&P 500 emini ES contract is 43 ticks higher and trading at 2133.75.
Gold: The December gold contract is trading Up at 1262.70. Gold is 61 ticks higher than its close.
Initial Conclusion
This is not a correlated market. The dollar is Down- and crude is Up+ which is normal but the 30 year bond is trading Down. The Financials should always correlate with the US dollar such that if the dollar is lower then bonds should follow and vice-versa. The indices are Up and Crude is trading Up which is not correlated. Gold is trading Up which is not correlated with the US dollar trading Up. I tend to believe that Gold has an inverse relationship with the US Dollar as when the US Dollar is down, Gold tends to rise in value and vice-versa. Think of it as a seesaw, when one is up the other should be down. I point this out to you to make you aware that when we don’t have a correlated market, it means something is wrong. As traders you need to be aware of this and proceed with your eyes wide open.
All of Asia traded higher. As of this writing all of Europe is trading higher.
Possible Challenges To Traders Today
– CPI is out at 8:30 AM. This is major.
– Core CPI is out at 8:30 AM EST. This is major.
– NAHB Housing Market Index is out at 10 AM EST. This is major.
– TIC Long-Term Purchases is out at 4 PM.
Treasuries
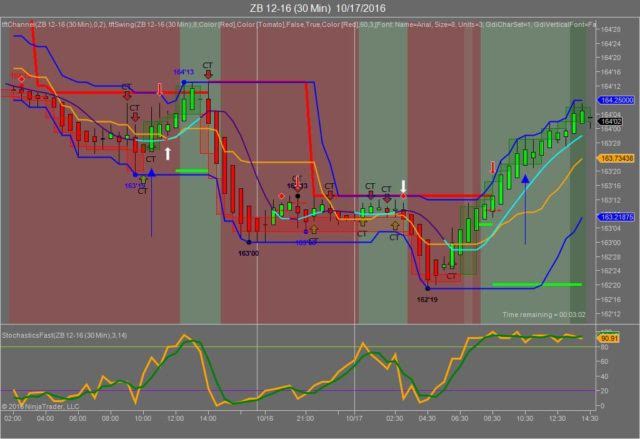
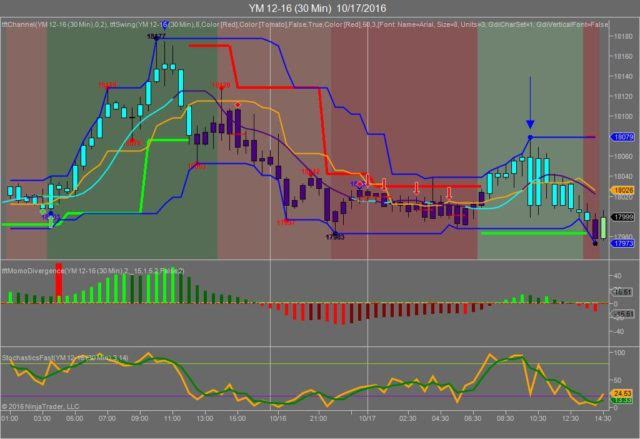
We’ve elected to switch gears a bit and show correlation between the 30 year bond (ZB) and The YM futures contract. The YM contract is the DJIA and the purpose is to show reverse correlation between the two instruments. Remember it’s liken to a seesaw, when up goes up the other should go down and vice versa.
Yesterday the ZB made it’s move at around 10 AM EST when most of the economic news was reported. The ZB hit a low at around that time and the YM hit a high. If you look at the charts below ZB gave a signal at around 10 AM EST and the YM was moving lower at the same time. Look at the charts below and you’ll see a pattern for both assets. ZB hit a low at around 10 AM EST and the YM hit a high. These charts represent the latest version of Trend Following Trades and I’ve changed the timeframe to a 30 minute chart to display better. This represented a long opportunity on the 30 year bond, as a trader you could have netted about 20 plus ticks per contract on this trade. Each tick is worth $31.25. We added a Donchian Channel to the charts to show the signals more clearly.
Charts Courtesy of Trend Following Trades built on a NinjaTrader platform
Bias
Yesterday we gave the markets a neutral bias as Crude, the Bonds and Gold were all trading down yesterday morning and whereas this should be construed as positive for the indices; they were moving lower yesterday morning. The Dow dropped 52 points and the other indices lost ground as well. Today we aren’t dealing with a correlated market and our bias is to the upside.
Could this change? Of Course. Remember anything can happen in a volatile market.
Commentary
Yesterday the Empire State Manufacturing Index was released at 8:30 AM EST and no sooner was it released when the markets fell and remained in negative territory for most of the trading session. This does not bode well for the markets as the manufacturing index represents manufacturing activity in various portions of the United States. If this is down it means manufacturing is down as well. The Fed should take note of this but no doubt will be more focused on CPI and Core CPI today as those are their main ingredients for rate hikes.
Trading performance displayed herein is hypothetical. The following Commodity Futures Trading Commission (CFTC) disclaimer should be noted.
Hypothetical performance results have many inherent limitations, some of which are described below. No representation is being made that any account will or is likely to achieve profits or losses similar to those shown.
In fact, there are frequently sharp differences between hypothetical performance results and the actual results subsequently achieved by any particular trading program. One of the limitations of hypothetical performance trading results is that they are generally prepared with the benefit of hindsight.
In addition, hypothetical trading does not involve financial risk, and no hypothetical trading record can completely account for the impact of financial risk in actual trading. For example, the ability to withstand losses or to adhere to a particular trading program in spite of trading losses are material points which can also adversely affect actual trading results.
There are numerous other factors related to the markets in general or to the implementation of any specific trading program which cannot be fully accounted for in the preparation of hypothetical performance results and all of which can adversely affect actual trading results.
Trading in the commodities markets involves substantial risk and YOU CAN LOSE A LOT OF MONEY, and thus is not appropriate for everyone. You should carefully consider your financial condition before trading in these markets, and only risk capital should be used.
In addition, these markets are often liquid, making it difficult to execute orders at desired prices. Also, during periods of extreme volatility, trading in these markets may be halted due to so-called “circuit breakers” put in place by the CME to alleviate such volatility. In the event of a trading halt, it may be difficult or impossible to exit a losing position.
Recommended Content
Editors’ Picks
EUR/USD retreats below 1.0700 after US GDP data

EUR/USD came under modest bearish pressure and retreated below 1.0700. Although the US data showed that the economy grew at a softer pace than expected in Q1, strong inflation-related details provided a boost to the USD.
GBP/USD declines below 1.2500 as USD rebounds

GBP/USD declined below 1.2500 and erased the majority of its daily gains with the immediate reaction to the US GDP report. The US economy expanded at a softer pace than expected in Q1 but the price deflator jumped to 3.4% from 1.8%.
Gold holds near $2,330 despite rising US yields

Gold stays in positive territory near $2,330 in the second half of the day on Thursday. The benchmark 10-year US Treasury bond yield is up more than 1% on the day above 4.7% after US GDP report, making it difficult for XAU/USD to extend its daily rally.
XRP extends its decline, crypto experts comment on Ripple stablecoin and benefits for XRP Ledger

Ripple extends decline to $0.52 on Thursday, wipes out weekly gains. Crypto expert asks Ripple CTO how the stablecoin will benefit the XRP Ledger and native token XRP.
After the US close, it’s the Tokyo CPI

After the US close, it’s the Tokyo CPI, a reliable indicator of the national number and then the BoJ policy announcement. Tokyo CPI ex food and energy in Japan was a rise to 2.90% in March from 2.50%.