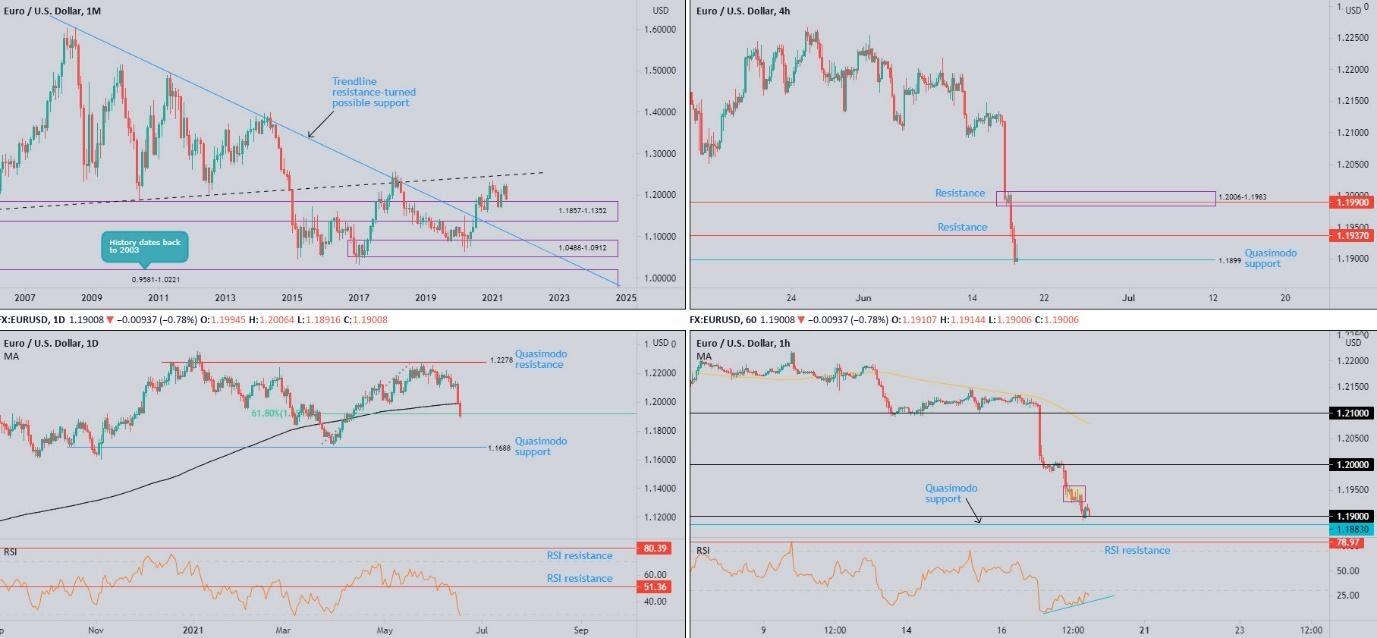
EUR/USD:
Monthly timeframe:
(Technical change on this timeframe is often limited, though serves as guidance to potential longer-term moves)
Down by 2.6 percent MTD, June has reclaimed May’s gains and is now within a stone’s throw from revisiting support at 1.1857-1.1352.
Upstream, the technical spotlight is concentrated on 2021 peaks at 1.2349, with additional upside possibly welcoming ascending resistance (prior support [1.1641]).
Based on trend studies, the primary uptrend has been underway since price broke the 1.1714 high (Aug 2015) in July 2017. Additionally, price breached major trendline resistance, taken from the high 1.6038, in July 2020.
Daily timeframe:
Versus a basket of foreign currencies, the US dollar index (ticker: DXY) extended recovery gains on Thursday, 24 hours after the US Federal Reserve surprised markets.
Dollar support bruised recent EUR/USD action. Notably, the currency pair tunnelled through the 200-day simple moving average, currently circling 1.1991—movement typically viewed as a bearish cue. Should sellers override any technical bids surfacing around the 61.8% Fib retracement at 1.1918, this emphasises a downward bias and has Quasimodo support at 1.1688 calling for attention.
Trend on the daily timeframe has been somewhat muted since 2021. 2020, nevertheless, was a relatively strong period for the unit.
The timeframe’s RSI indicator, following last week’s move through support at 51.36, is now on the doorstep of oversold space (an area possibly drawing bullish awareness).
H4 timeframe:
Thursday’s follow-through descent, as you can see, not only established clear-cut supply at 1.2006-1.1983, the move also absorbed two support levels at 1.1990 and 1.1937.
Recent hours, nonetheless, witnessed the one-sided decline confront Quasimodo support from 1.1899, which, for now at least, is serving as a floor. Upside attempts are likely to be limited by 1.1937, while sellers regaining control south of 1.1899 suggests demand at 1.1794-1.1822 could make an entrance.
H1 timeframe:
A closer examination of price action on the H1 chart witnessed the 1.19 figure welcome the pair during US hours on Thursday, a level organised north of Quasimodo support from 1.1883. A EUR/USD bid throws light on the key figure 1.20 (supply marked yellow between 1.1958 and 1.1926 is potentially fragile).
Reinforcing 1.19 support is RSI bullish divergence within oversold territory—this indicates increased momentum to the upside. However, traders are likely watching for the indicator to exit oversold before taking action.
Observed levels:
61.8% Fib retracement at 1.1918 on the daily timeframe, coupled with H4 Quasimodo support from 1.1899 and the combination of the 1.19 figure on the H1 and neighbouring Quasimodo support at 1.1883, offers an area of support to work with. Upside targets rest at H4 resistance from 1.1937, the underside of the 200-day simple moving average around 1.1991 and H4 supply at 1.2006-1.1983 (houses the 1.20 figure on the H1).
Alternatively, keep eyes on the upper side of monthly support at 1.1857. which may be tested should a 1.19 breach come about.
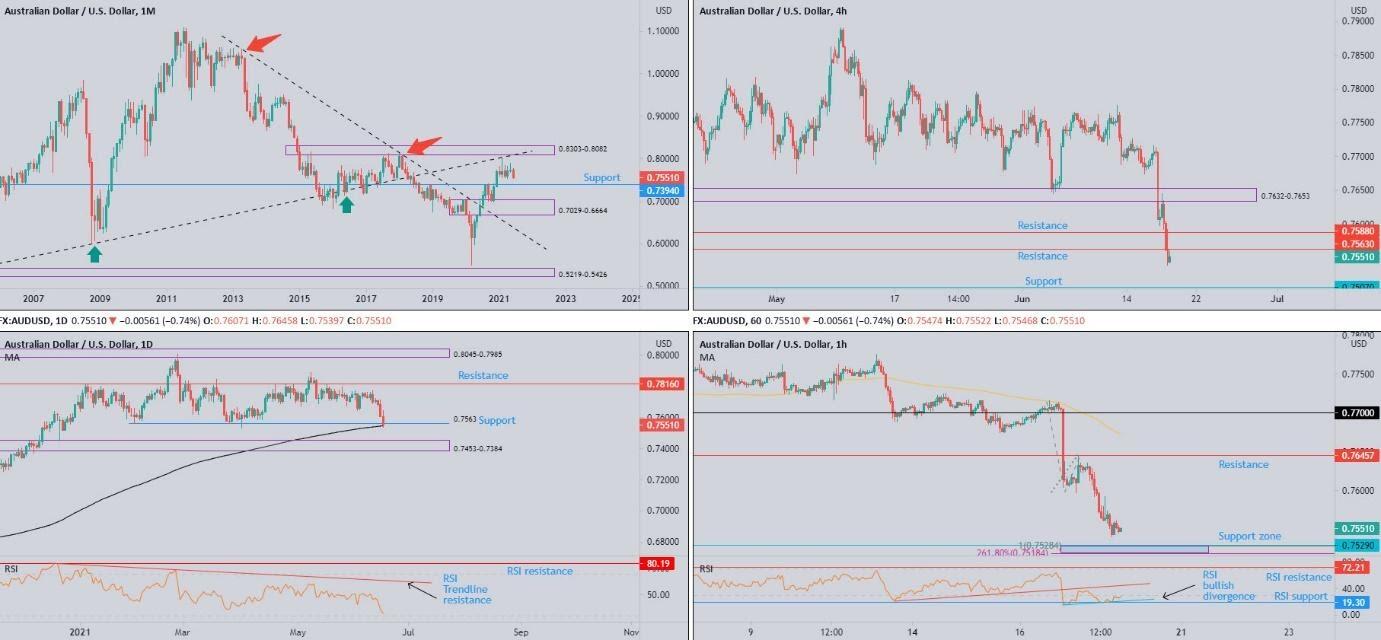
AUD/USD:
Monthly timeframe:
(Technical change on this timeframe is often limited, though serves as guidance to potential longer-term moves)
Since the beginning of 2021, buyers and sellers have been battling for position south of trendline resistance (prior support - 0.4776 low) and supply from 0.8303-0.8082.
Support is featured at 0.7394, with additional pressure targeting demand at 0.7029-0.6664 (prior supply).
June is currently down by 2.3 percent.
Trend studies (despite the trendline resistance [1.0582] breach in July 2020) show the primary downtrend (since mid-2011) remains in play until breaking 0.8135 (January high [2018]).
Daily timeframe:
AUD/USD failed to exploit Thursday’s early bid on the back of optimistic Australian job’s data, as USD upside added to recent Fed-induced gains. This ultimately weighed on the currency pair, pencilling in a third successive daily loss and crossing swords with the 200-day simple moving average at 0.7548 and support from 0.7563.
Space south of the SMA casts light on supply-turned demand at 0.7453-0.7384.
With respect to trend, despite a directionless tone since 2021, the currency pair has been higher for most of 2020 (from pandemic lows at 0.5506).
The RSI, however, is bound for oversold space, currently trading at 32.39.
H4 timeframe:
Following 0.7632-0.7653 welcoming a retest, a strong bearish wind emerged and pulled the currency pair under two Quasimodo supports at 0.7588 and 0.7563, both of which now represent potential resistance.
Elsewhere on the chart, support is seen in the shape of a Quasimodo formation at 0.7507.
H1 timeframe:
Drawn from 22nd December 2020, Quasimodo support rests at 0.7529, joining hands with a 100% Fib projection at 0.7528. Harmonic traders will note this base also represents an AB=CD bullish formation, accompanied by a 2.618% Fib extension at 0.7518 of the C-retracement.
Out of the RSI indicator, bullish divergence is unfolding off support at 19.30. The value exiting oversold may strive for the 50.00 centreline which aligns with trendline support-turned resistance, taken from the low 22.47.
Observed levels:
Noting daily flow touching gloves with the 200-day simple moving average at 0.7548, as well as support from 0.7563, H4 sellers reaching for support at 0.7507 may struggle as H1 buyers could set up a defence off support drawn between 0.7518 and 0.7528 (blue).
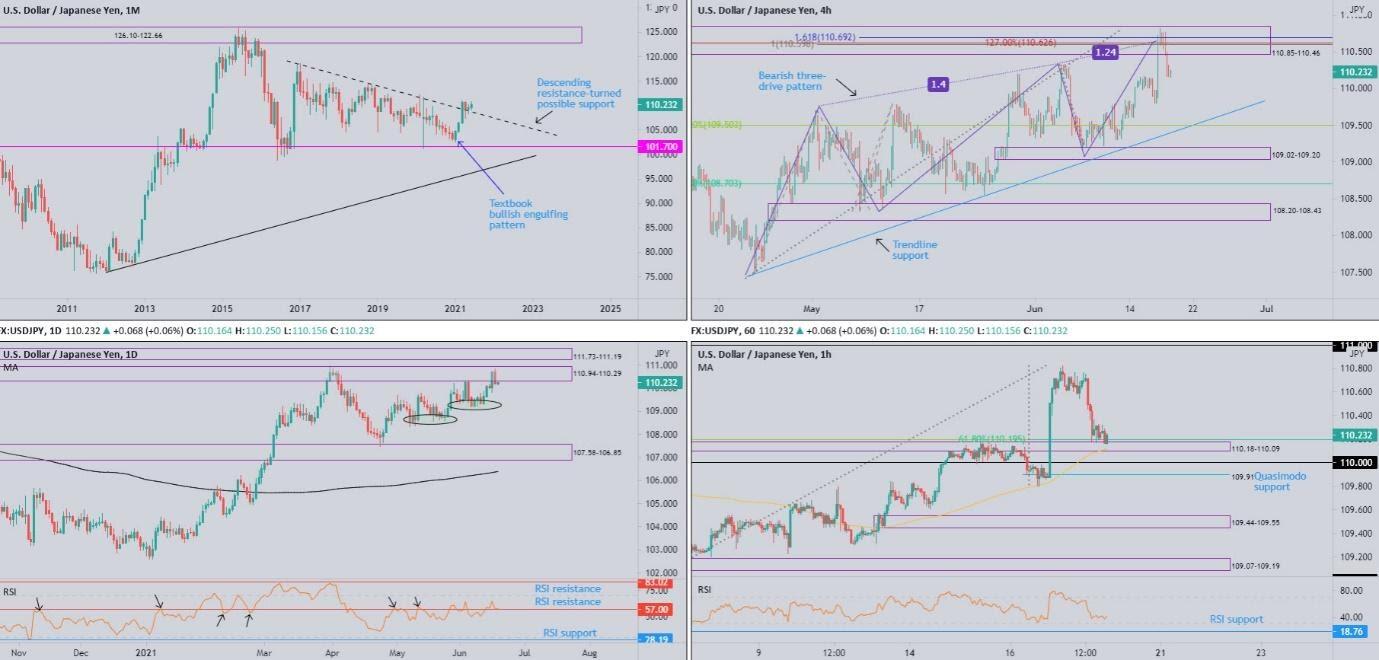
USD/JPY:
Monthly timeframe:
(Technical change on this timeframe is often limited, though serves as guidance to potential longer-term moves)
Following January’s bullish engulfing candle and February’s outperformance, March concluded up by 3.9 percent and cut through descending resistance, etched from the high 118.66.
Although April finished lower by 1.3 percent and snapped the three-month winning streak, May (+0.2 percent) held the breached descending resistance, echoing potential support for the month of June, currently trading higher by 0.6 percent.
Daily timeframe:
Long-term resistance at 110.94-110.29—posted under supply at 111.73-111.19—made a show in recent movement, with Thursday enticing bearish flow and erasing a large portion of Wednesday’s upside.
Downside structure to be cognisant of are lows around the 109.19 (upper green oval), closely shadowed by 108.60ish lows (lower green oval), with subsequent selling to perhaps bump heads with supply-turned demand at 107.58-106.85.
As stated in previous writing, trend studies reveal the pair has been trending higher since the beginning of the year, though discovered a top heading into early April. Recent research also showed the RSI continuing to oscillate around resistance at 57.00. Additional structure can be found at support from 28.19 and resistance drawn from 83.02.
H4 timeframe:
Wednesday, as you can see, charged into supply at 110.85-110.46, an area which housed a number of Fib studies and the completion of a three-drive bearish formation (the 1.272% Fib extension at 110.63), and has so far welcomed a bearish vibe.
The 38.2% and 61.8% Fib retracement values at 109.50 and 108.70, respectively, offer reasonably logical downside targets (drawn from the origin of the three-drive pattern [107.48] to recent tops at 110.84). Note the chart also displays trendline support, taken from the low 107.48, plotted close by demand at 109.02-109.20.
H1 timeframe:
Leaving the 111 figure unchallenged on Thursday, sellers stepped forward a touch north of 110.80 and hauled price action back to a supply-turned demand base at 110.18-110.09. Technical elements show the area brings with it 38.2% and 61.8% Fib retracement values around 110.20ish, in addition to the 20-period simple moving average at 110.12.
It is worth pencilling in the Quasimodo support situated just under 110 at 109.91.
Short-term momentum, according to the RSI oscillator, is depressed, exploring space south of the 50.00 centreline and consequently threatening moves into oversold water (possibly eyeballing indicator support at 18.76).
Observed levels:
The technical framework points to two possible scenarios:
Given H4 supply at 110.85-110.46 is housed within longer-term daily resistance at 110.94-110.29, and the H4 area is joined by a recently completed three-drive bearish pattern, sellers may take aim at the 38.2% Fib retracement value from 109.50.
Knowing the monthly scale is in the process of attempting to take hold of a breached descending resistance, the H1 chart may respond from either demand at 110.18-110.09 (joined by Fib studies and the 100-period SMA), or the chart may witness a whipsaw through 110 bids to collect fuel (stops) to fill bids around Quasimodo support at 109.91 for a possible bullish play.
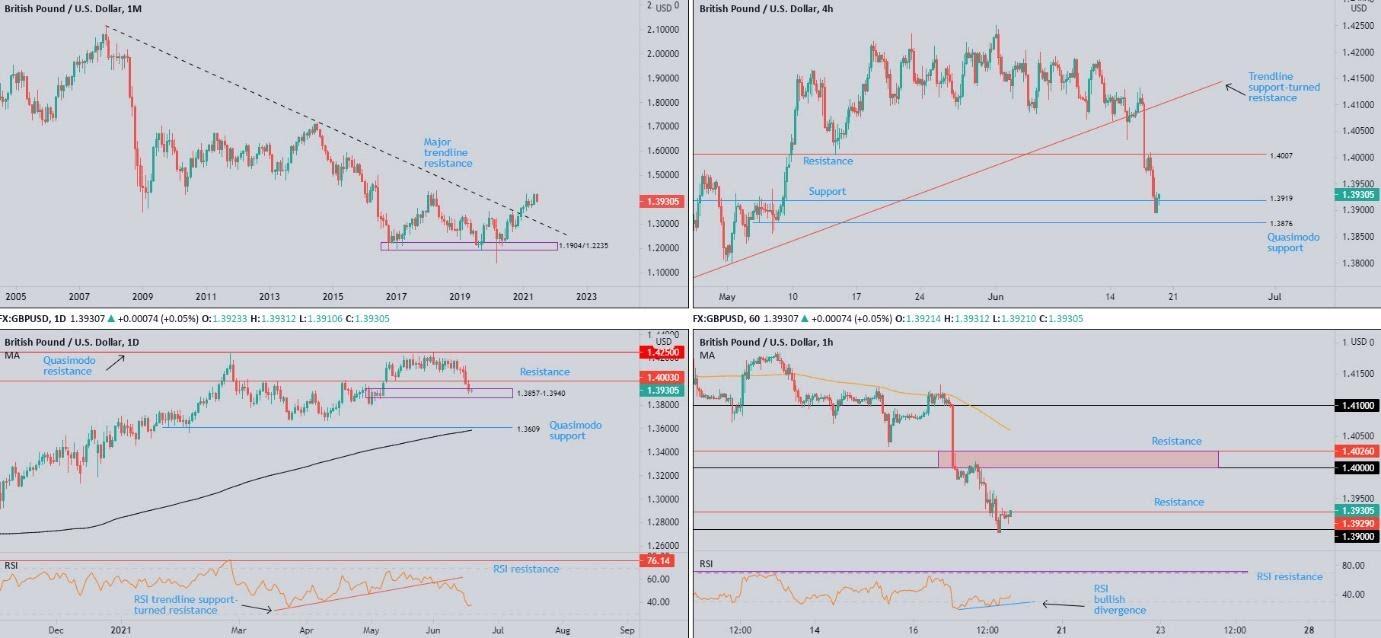
GBP/USD:
Monthly timeframe:
(Technical change on this timeframe is often limited, though serves as guidance to potential longer-term moves)
The pendulum moved in favour of buyers following December’s 2.5 percent advance, stirring major trendline resistance (2.1161). February subsequently followed through to the upside (1.7 percent).
May, despite diminished volatility during March and April, traded firmly on the front foot, up by 2.8 percent. June, however, is depressed (down 2 percent), albeit recording fresh YTD peaks at 1.4250.
Despite the trendline breach (which could serve as support if retested), primary trend structure has faced lower since early 2008, unbroken (as of current price) until 1.4376 gives way (April high 2018).
Daily timeframe:
In the shape of five consecutive losing sessions, sterling nosedived through support at 1.4003 (now labelled resistance) and locked horns with demand at 1.3857-1.3940—an important technical area where a decision was made to INITIALLY break above 1.4003 resistance.
Though efforts to defend demand may be limited by 1.4003, terrain south of the area unearths Quasimodo support at 1.3609 and neighbouring 200-day simple moving average circling 1.3587.
As for the RSI indicator’s location, the value nudged below 40.00 and is on the doorstep of oversold territory.
H4 timeframe:
Latest from the H4 chart has the currency pair toying with support around the 1.3919ish region, following an earlier test of resistance from 1.4007. Also of technical note is Quasimodo support registered at 1.3876.
Both 1.3919 and 1.3876 reside within daily demand highlighted above at 1.3857-1.3940.
H1 timeframe:
From the H1 chart, the technical landscape shows bulls holding 1.39 as support and, as we write, taking a stab at overthrowing resistance from 1.3929. This is accompanied by RSI bullish divergence out of oversold territory.
Should bulls take 1.3929, limited resistance is visible overhead until 1.4026-1.40.
Observed levels:
Daily demand at 1.3857-1.3940 making an appearance, and H4 support emerging from 1.3919, places H1 bids off 1.39 in a favourable spot, technically speaking. Running above H1 resistance at 1.3929, therefore, may unlock a bullish scenario, targeting H1 resistance from 1.4026-1.40.
This material on this website is intended for illustrative purposes and general information only. It does not constitute financial advice nor does it take into account your investment objectives, financial situation or particular needs. Commission, interest, platform fees, dividends, variation margin and other fees and charges may apply to financial products or services available from FP Markets. The information in this website has been prepared without taking into account your personal objectives, financial situation or needs. You should consider the information in light of your objectives, financial situation and needs before making any decision about whether to acquire or dispose of any financial product. Contracts for Difference (CFDs) are derivatives and can be risky; losses can exceed your initial payment and you must be able to meet all margin calls as soon as they are made. When trading CFDs you do not own or have any rights to the CFDs underlying assets.
FP Markets recommends that you seek independent advice from an appropriately qualified person before deciding to invest in or dispose of a derivative. A Product Disclosure Statement for each of the financial products is available from FP Markets can be obtained either from this website or on request from our offices and should be considered before entering into transactions with us. First Prudential Markets Pty Ltd (ABN 16 112 600 281, AFS Licence No. 286354).
Recommended Content
Editors’ Picks
EUR/USD clings to daily gains above 1.0650

EUR/USD gained traction and turned positive on the day above 1.0650. The improvement seen in risk mood following the earlier flight to safety weighs on the US Dollar ahead of the weekend and helps the pair push higher.
GBP/USD recovers toward 1.2450 after UK Retail Sales data

GBP/USD reversed its direction and advanced to the 1.2450 area after touching a fresh multi-month low below 1.2400 in the Asian session. The positive shift seen in risk mood on easing fears over a deepening Iran-Israel conflict supports the pair.
Gold holds steady at around $2,380 following earlier spike

Gold stabilized near $2,380 after spiking above $2,400 with the immediate reaction to reports of Israel striking Iran. Meanwhile, the pullback seen in the US Treasury bond yields helps XAU/USD hold its ground.
Bitcoin Weekly Forecast: BTC post-halving rally could be partially priced in Premium

Bitcoin price shows no signs of directional bias while it holds above $60,000. The fourth BTC halving is partially priced in, according to Deutsche Bank’s research.
Week ahead – US GDP and BoJ decision on top of next week’s agenda

US GDP, core PCE and PMIs the next tests for the Dollar. Investors await BoJ for guidance about next rate hike. EU and UK PMIs, as well as Australian CPIs also on tap.