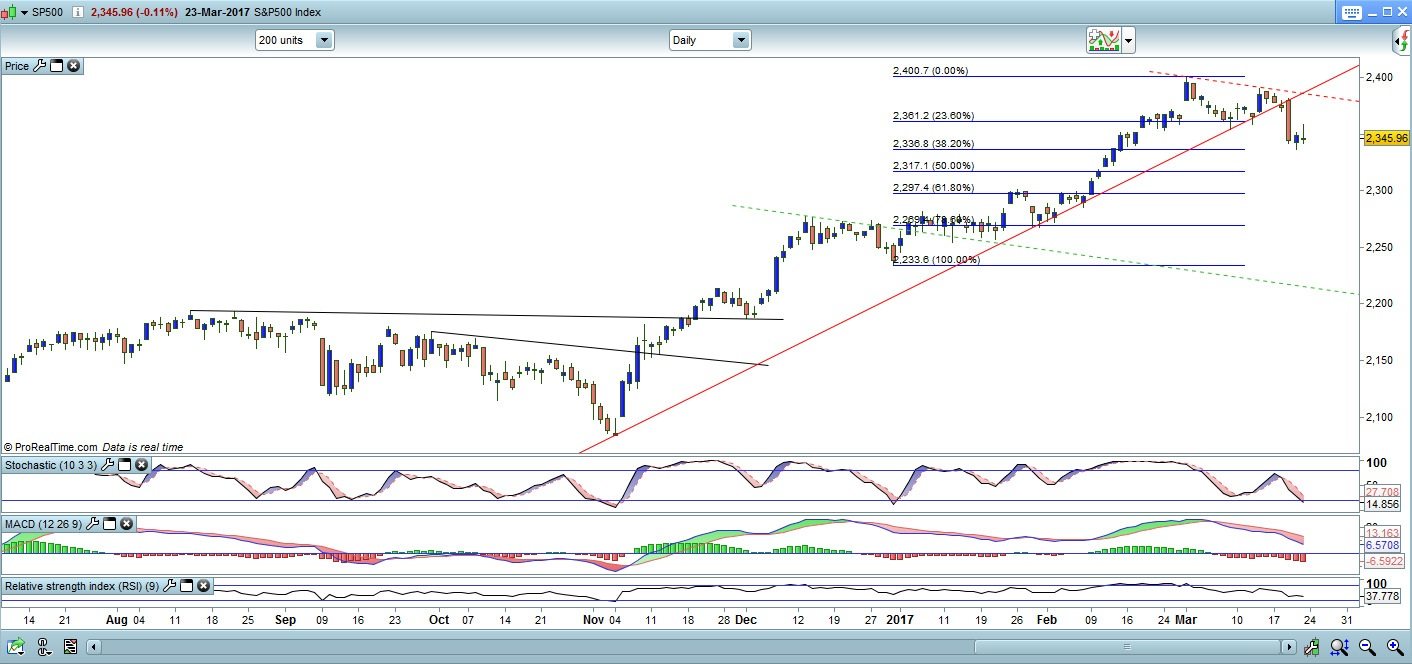
S&P 500 24/03/17
S&P tried to correct but faltered at 2358 which was the 50% short term fib...This provoked another assault on the downside.. but no real damage was done and the market held 2342...slightly up today pre open ...again we are looking at 2353...If above here we look for 2358 to 2361...I would take profits in this area...Only re-instate longs above 2363 for 2374/75...Now on the downside we again have 2342 but more importantly 2336...This is major support for the S&P...it will be quite dire if we lose this support because we would be looking at 2317 as a viable targeted area....
DJI 20611 is the key today....because the trendline I have been watching intersects with this 38.2 med term fib ad this is what held us Wednesday....It might be prudent to attempt longs down to here keeping stops below 20580....as long as we can hold this region above stated there is a good chance we can remain in the uptrend and look initially for 20784 to 20830....Cover longs to here...Only above 20850 would we see further recovery..
Nas remains looking weak at this point...we are on course for a reversal week if the close is below 5360....That was last weeks low....Sop will offer support on a close basis tonight....we fail to close above here we not only have a key day reversal evident...we have a reversal week...Now the Nas does have these reversal patterns....most work.. some don't....but if we do see a close below 5360 especially with the weeklies looking to turn lower then the next few weeks will be rocky for Nas... we are seeing a " dead cat bounce" currently...and these usually last no more than 3 days.... So a dead cat bounce top should not exceed 5395....If this area is seen it will encourage sellers back in the market...and hopefully give it a bit of a shove lower.... A close above 5360 does not take the real pressure off....but a close above 5400 would....
The research provided by Charmer Charts is provided solely to enable clients to make their own investment decisions and does not constitute personal investment recommendations. No recommendations are made directly or indirectly by Technicalanalysisreports.com or Charmer Charts as to the merits or suitability of any investment decision or transaction that may result directly or indirectly from having viewed the technical analysis investment research. Customers are therefore urged to seek independent financial advice if they are in any doubt. The value of investments and the income derived from them can go down as well as up, and you may not get back the full amount you originally invested. Derivatives and foreign exchange trading are particularly high-risk, high-reward investment instruments and an investor may lose some or all of his or her original investment. Also, if you decide to acquire any investment denominated in a different currency you should note that changes in foreign exchange rates may have an adverse effect on the value, price and income of the investment in your own currency. Technicalanalysisreports.com or Charmer Charts shall not be liable for any direct or indirect, incidental or consequential loss or damage (including loss of profits, revenue or goodwill) arising from the use, inability to use, interruption or non-availability of the technical analysis investment research or any part of the research materials published or otherwise any loss of data on transmission, howsoever caused. Whilst the research material published is believed to be reliable and accurate, it is not independently verified. Accordingly, no representation or warranty is made or given by Technicalanalysisreports.com or Charmer Charts, its officers, agents or employees as to the accuracy or completeness of the same and no such person shall have liability for any inaccuracy in, or omission from, such materials.
Recommended Content
Editors’ Picks
AUD/USD posts gain, yet dive below 0.6500 amid Aussie CPI, ahead of US GDP

The Aussie Dollar finished Wednesday’s session with decent gains of 0.15% against the US Dollar, yet it retreated from weekly highs of 0.6529, which it hit after a hotter-than-expected inflation report. As the Asian session begins, the AUD/USD trades around 0.6495.
USD/JPY finds its highest bids since 1990, approaches 156.00

USD/JPY broke into its highest chart territory since June of 1990 on Wednesday, peaking near 155.40 for the first time in 34 years as the Japanese Yen continues to tumble across the broad FX market.
Gold stays firm amid higher US yields as traders await US GDP data

Gold recovers from recent losses, buoyed by market interest despite a stronger US Dollar and higher US Treasury yields. De-escalation of Middle East tensions contributed to increased market stability, denting the appetite for Gold buying.
Ethereum suffers slight pullback, Hong Kong spot ETH ETFs to begin trading on April 30

Ethereum suffered a brief decline on Wednesday afternoon despite increased accumulation from whales. This follows Ethereum restaking protocol Renzo restaked ETH crashing from its 1:1 peg with ETH and increased activities surrounding spot Ethereum ETFs.
Dow Jones Industrial Average hesitates on Wednesday as markets wait for key US data

The DJIA stumbled on Wednesday, falling from recent highs near 38,550.00 as investors ease off of Tuesday’s risk appetite. The index recovered as US data continues to vex financial markets that remain overwhelmingly focused on rate cuts from the US Fed.