EUR/USD Current Price: 1.0872
View Live Chart for the EUR/USD
The American dollar fell against all of its major rivals but the EUR on Monday, as investors struggled to stay positive. The day started with China extending its easing policy further with a general cut in the reserve requirement ratio of 0.5 percentage points, which led to strong declines in Asian stocks. In Europe, the EU inflation data surprised on the downside, as February readings came out at -0.2% compared to a year before, while the core annual reading shrunk to 0.7%. The common currency came under pressure as the market is pricing in a 15bps deposit rate cut in the upcoming ECB meeting, and remained subdued, despite US macro figures disappointed. The Pending Home Sales Index declined 2.5% over the month, falling from December’s upwardly revised reading of 108.7 to a level of 106.0 in January, while the Chicago PMI plummeted to 47.6 from the previous 55.6.
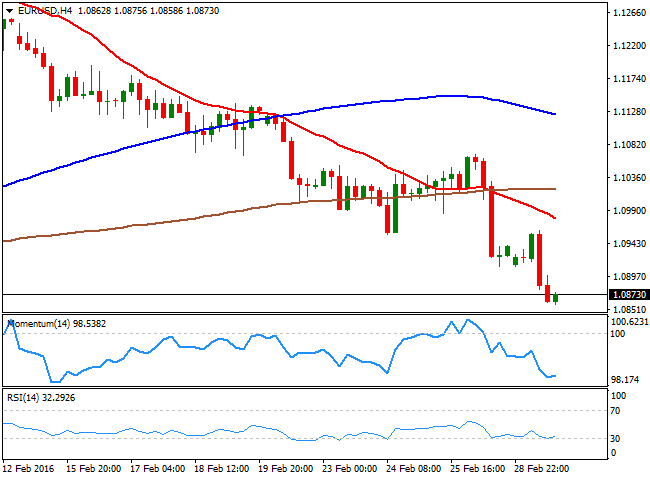
The common currency was on its back foot ever since the day started, advancing briefly towards 1.0960 at the London opening before falling to fresh lows at 1.0858. Despite broad dollar's weakness, the pair consolidates near its daily low by the end of the day, maintaining a generally negative technical tone. Short term, the 1 hour chart shows that the price remains below a bearish 20 SMA, while the indicators head south within bearish territory, indicating the risk remains towards the downside. In the 4 hours chart, the technical picture also favors additional declines, although the technical indicators have lost bearish strength around oversold levels. Some consolidation could be expected, with strong buying interest aligned around 1.0810, and large stops below it that if triggered, could see the pair approaching 1.0700 next Tuesday.
Support levels: 1.0850 1.0810 1.0770
Resistance levels: 1.0920 1.0960 1.1000
EUR/JPY Current price: 124.64
View Live Chart for the EUR/JPY
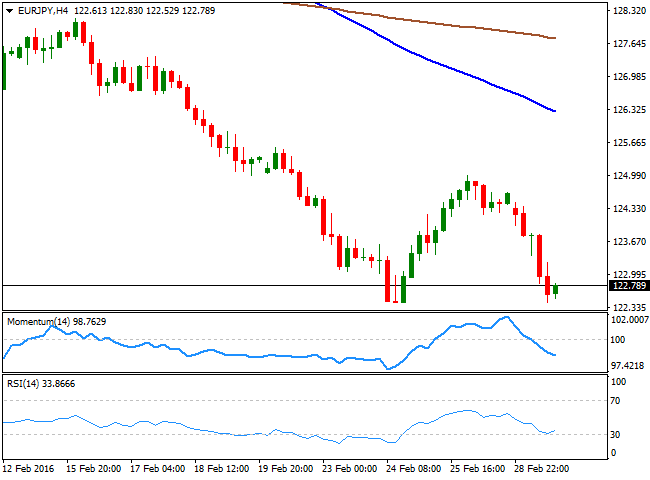
The Japanese Yen opened the week with a strong footing, helped by falling stocks for most of the first two sessions of the day, although Wall Street trades slightly higher by the end of the day. The EUR/JPY pair resumed its slide, also helped by a weaker EUR, and flirted with the low set last week at 122.43, now trading a few pips above it. From a technical point of view, the pair presents a bearish tone, as in the 1 hour chart, the price has extended, and found resistance on an intraday advance, at its 100 SMA, currently at 123.80. In the same chart, the technical indicators have managed to correct from oversold levels, but remain well into negative territory, with no upward strength. In the 4 hours chart, the Momentum heads sharply lower below its 100 level, the RSI indicator hovers around 33, whilst the 100 SMA has accelerated its decline below the 200 SMA far above the current level, supporting some further declines on a break below the mentioned low.
Support levels: 122.45 122.00 121.65
Resistance levels: 123.20 123.60 124.10
GBP/USD Current price: 1.3911
View Live Chart for the GBP/USD
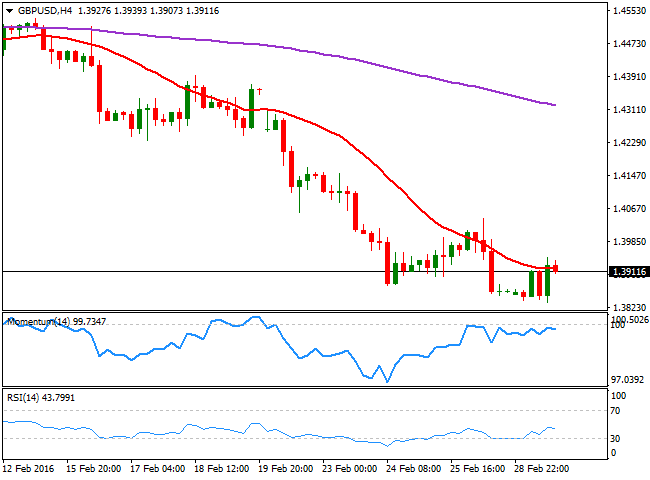
The British Pound recovered some ground in the American afternoon, after extending its decline down to 1.3835 against the greenback at the beginning of the American session, a new almost 6-year low. Tepid US housing and manufacturing figures helped the GBP/USD pair to bounce, and even correct the extreme oversold readings seen in the daily chart. But the negative sentiment towards the Pound prevails ever since the announcement of the date of the referendum on whether to stay or not within the EU, and selling interest at higher levels will likely be the way to play the pair. Technically, the 1 hour chart shows that the latest advance has helped the pair to recover above its 20 SMA and the technical indicators extend above their mid-lines, but are currently turning south in positive territory. In the 4 hours chart, the price is unable to advance beyond a horizontal 20 SMA, while the technical indicators lack directional strength below their mid-lines, given no clear clues on what's next for the pair, although the risk is clearly towards the downside. At this point, the price needs to break below the mentioned low to confirm a firmer downward continuation, with a break below the 1.3800 figure exposing the pair to a retest of 1.3501, 2009 low.
Support levels: 1.3860 1.3835 1.3790
Resistance levels: 1.3940 1.3985 1.4020
USD/JPY Current price: 112.96
View Live Chart for the USD/JPY
The USD/JPY pair lost around 100 pips from its Friday's close, as the G20 meeting that took place in Shanghai during the weekend, failed to boost market's sentiment. The Group committed to going beyond easy-money monetary policy to pursue structural reforms in their respective countries to strengthen the global economy, but as usual, no actual decision was made. The pair's decline stalled during the American afternoon, as local share markets turned positive, but poor US data maintained the upside limited. From a technical point of view, the 1 hour chart shows that the price is struggling around the 200 SMA, while the 100 SMA heads slightly higher around 112.55, providing an immediate intraday support. In the same chart, the Momentum indicator aims higher, but remains below its 100 level, while the RSI indicator resumed its decline around 43, in line with further declines. In the 4 hours chart, the price retreated from a bearish 100 SMA, while the Momentum indicator heads south and nears its 100 level, and the RSI stand flat around 50.
Support levels: 112.45 112.00 111.65
Resistance levels: 113.20 113.70 114.10
AUD/USD Current price: 0.7141
View Live Chart for the AUD/USD
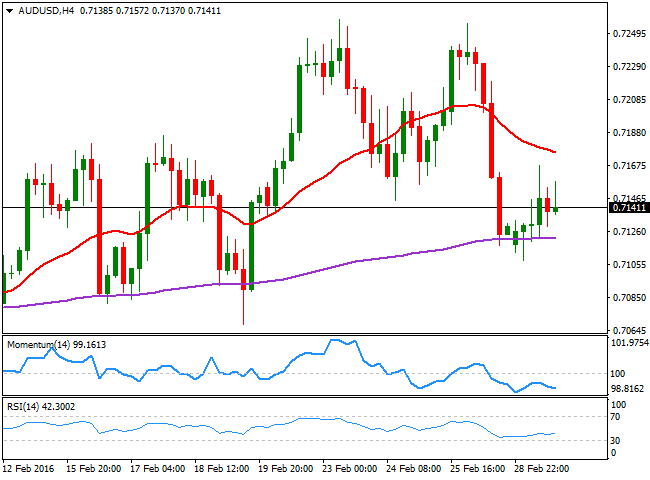
The AUD/USD pair approached the 0.7100 level at the beginning of the day, pressured by poor Australian inflation data. The Melbourne Institute monthly inflation gauge fell by 0.2% in February, after rising by 0.4% in January. In the twelve months to February, the Inflation Gauge increased by 2.1% after a rise of 2.3% for the twelve months to January. The pair however, recovered some ground, although investors have remained side-lined in the Aussie ahead of the upcoming RBA economic policy decision, early Tuesday. The Central Bank is largely expected to remain on hold, with the attention focused in the statement and any clue it could offer on upcoming moves. From a technical point of view, the downward potential seems to be increasing, as in the 1 hour chart, the price stands barely above a mild bullish 20 SMA, whilst the technical indicators turned south around their mid-lines. In the 4 hours chart, the price continues to hold above the 200 EMA, but the technical indicators head south within bearish territory whilst the 20 SMA caps the upside around 0.7185.
Support levels: 0.7115 0.7070 0.7025
Resistance levels: 0.7185 0.7240 0.7275
Information on these pages contains forward-looking statements that involve risks and uncertainties. Markets and instruments profiled on this page are for informational purposes only and should not in any way come across as a recommendation to buy or sell in these assets. You should do your own thorough research before making any investment decisions. FXStreet does not in any way guarantee that this information is free from mistakes, errors, or material misstatements. It also does not guarantee that this information is of a timely nature. Investing in Open Markets involves a great deal of risk, including the loss of all or a portion of your investment, as well as emotional distress. All risks, losses and costs associated with investing, including total loss of principal, are your responsibility. The views and opinions expressed in this article are those of the authors and do not necessarily reflect the official policy or position of FXStreet nor its advertisers. The author will not be held responsible for information that is found at the end of links posted on this page.
If not otherwise explicitly mentioned in the body of the article, at the time of writing, the author has no position in any stock mentioned in this article and no business relationship with any company mentioned. The author has not received compensation for writing this article, other than from FXStreet.
FXStreet and the author do not provide personalized recommendations. The author makes no representations as to the accuracy, completeness, or suitability of this information. FXStreet and the author will not be liable for any errors, omissions or any losses, injuries or damages arising from this information and its display or use. Errors and omissions excepted.
The author and FXStreet are not registered investment advisors and nothing in this article is intended to be investment advice.
Recommended Content
Editors’ Picks
EUR/USD climbs to 10-day highs above 1.0700

EUR/USD gained traction and rose to its highest level in over a week above 1.0700 in the American session on Tuesday. The renewed US Dollar weakness following the disappointing PMI data helps the pair stretch higher.
GBP/USD extends recovery beyond 1.2400 on broad USD weakness

GBP/USD gathered bullish momentum and extended its daily rebound toward 1.2450 in the second half of the day. The US Dollar came under heavy selling pressure after weaker-than-forecast PMI data and fueled the pair's rally.
Gold trims losses on disappointing US PMIs

Gold (XAU/USD) reclaims part of the ground lost and pares initial losses on the back of further weakness in the Greenback following disheartening US PMIs prints.
Here’s why Ondo price hit new ATH amid bearish market outlook Premium

Ondo price shows no signs of slowing down after setting up an all-time high (ATH) at $1.05 on March 31. This development is likely to be followed by a correction and ATH but not necessarily in that order.
Germany’s economic come back

Germany is the sick man of Europe no more. Thanks to its service sector, it now appears that it will exit recession, and the economic future could be bright. The PMI data for April surprised on the upside for Germany, led by the service sector.


