EUR/USD Current price: 1.0993
View Live Chart for the EUR/USD
The EUR/USD pair closed the week a few pips below the 1.1000 level, with solid gains for a second week in-a-row. On Friday, trading was mostly led by sentiment, with oil plummeting amid OPEC's decision to keep production at record highs, dragging worldwide stocks alongside with it. The main macroeconomic event of the day was the release of US Retail Sales that rose in November by the most in four months, up by 0.2% compared to a month before, but below market's expectation. Investors were quite sensitive and will remain so ahead of the US Federal Reserve meeting and economic to be held this week, in which the Central Bank may finally raise rates for the first time in almost a decade.
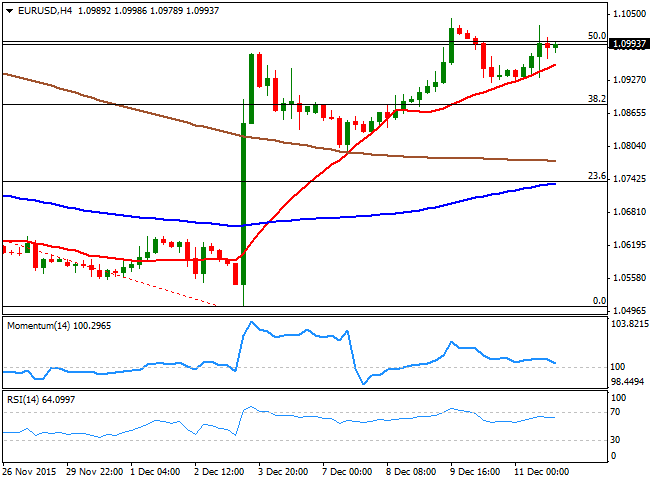
In the meantime, the EUR/USD pair retains the bullish tone triggered by ECB's decision to keep unchanged the amount of bonds' purchasing early December, and the pair trades around the 50% retracement of the 1.1494/1.0505 monthly decline. The technical setup in the daily chart supports additional gains given that the 20 SMA heads higher well below the current level whilst the technical indicators head north near overbought levels. The pair however, has been having a hard time to extend beyond the 1.1000 figure, with selling interest on spikes beyond it. Also the 100 and 200 SMAs offer resistance in the 1.1060/80, and a break above it is required to confirm a more constructive tone. Shorter term, the 4 hours chart shows that the pair has been finding support in a bullish 20 SMA, although the technical indicators have lost their upward strength and head lower, but above their mid-lines.
Support levels: 1.0960 1.0920 1.0880
Resistance levels: 1.1045 1.1080 1.1120
EUR/JPY Current price: 132.98
View Live Chart for the EUR/JPY
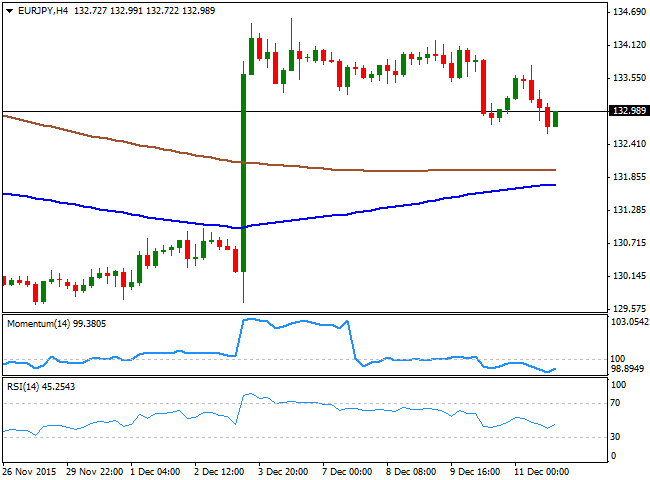
Demand for the Japanese yen continued on Friday, as risk sentiment dominated financial markets, particularly during the US session. The pair fell for a second day in-a-row, but posted limited losses amid EUR's demand as funding currency. Anyway, the bearish tone persists, as the daily chart shows that the pair posted a lower low and a lower high , whilst extending below a bearish 100 DMA. The technical indicators in the same chart have tune lower, but remain far from suggesting a bearish continuation at the time being. In the shorter term, and according to the 4 hour chart bears seem to be losing their grip as the pair remains well above its moving averages, whilst the technical indicators are turning north from near oversold levels.
Support levels: 132.55 132.10 131.70
Resistance levels: 133.30 133.75 134.20
GBP/USD Current price: 1.5224
View Live Chart for the GPB/USD
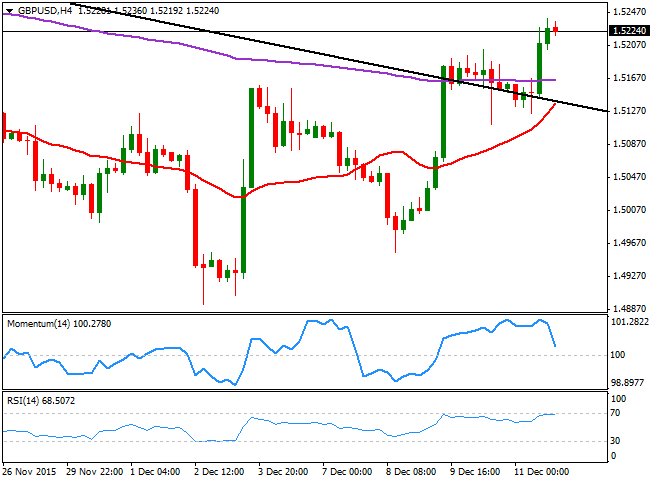
The British Pound was among the best performers on Friday, having benefited the most from dollar's self-off during the American afternoon. The GBP/USD pair closed the week at 1.5224, the highest since November 20th, having accelerated its advance after completing a pullback to the daily descendant trend line coming from November high, which has strong bullish implications. Nevertheless, the daily chart shows that the technical indicators lack enough momentum to confirm a stronger advance, while the 20 SMA, remains horizontal in the 1.5110 region, now a line in the sand for the ongoing bullish trend. In the shorter term, the 4 hours chart shows that the price has advanced above its 200 EMA, while the 20 SMA heads strongly higher below it, and converges with the broken trend line around 1.5140. The technical indicators however, have lost their upward strength, with the Momentum indicator having turned sharply lower and the RSI indicator retreating some from overbought readings, both of them suggesting some consolidation ahead before next move. Should the pair advance, it will meet a major resistance in the 1.5335 region, with a break above it required to confirm additional gains in term.
Support levels: 1.5190 1.5150 1.5110
Resistance levels: 1.5240 1.5280 1.5335
USD/JPY Current price: 120.95
View Live Chart for the USD/JPY
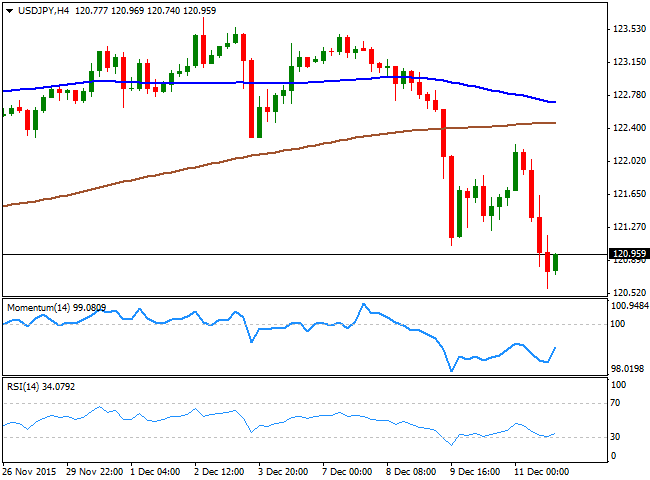
The USD/JPY pair extended its decline down to 120.57, as the Japanese currency benefited from an increasing risk aversion, which sent stocks plummeting in the US. The pair presents now a clear bearish tone, albeit there are some macroeconomic events ahead that may well trigger sharp directional moves that can change the whole technical picture. The first, will be the release of the Tankan manufacturing report in Japan at the beginning of the week, and the next will be the US Federal Reserve announcement next Wednesday, as if the Central Bank decides to raise rates, the dollar may recover its strength and soar against the JPY. At the time being, the price is below its 100 DMA, now acting as an immediate resistance around 121.25, while the technical indicators in the daily chart head sharply lower below their mid-lines, in line with a continued decline. In the 4 hours chart, the technical indicators turned higher from oversold territory, rather reflecting the latest short term bounce than suggesting an upward continuation for this Monday.
Support levels: 120.60 120.30 120.00
Resistance levels: 121.25 121.70 122.20
AUD/USD Current price: 0.7187
View Live Chart for the AUD/USD
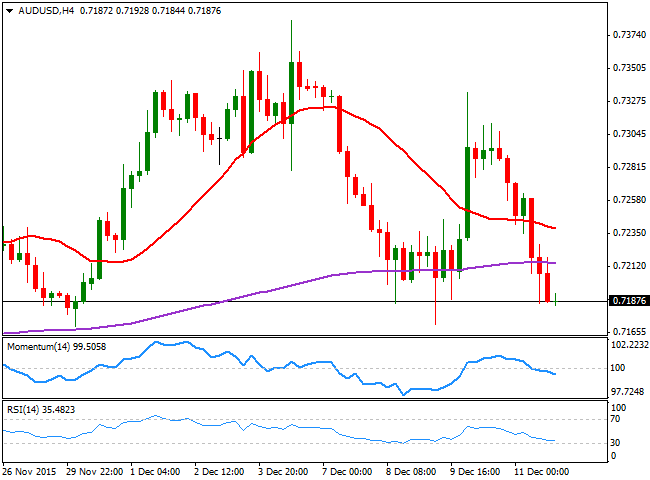
The Australian dollar ended the week with steep losses, ending below the 0.7200 figure against the greenback amid falling commodities' prices. The AUD/USD pair closed a handful of pips above its weekly low of 0.7171, a strong static support level for the upcoming session. Chinese news over the weekend, however, may help the antipodean currency recover some ground, as China's industrial production was stronger than expected in November, rising 6.2% compared to a year before, whilst Retail Sales in the same month grew at an annual pace of 11.2%. The news may bring some relief to the Aussie, yet as long as the pair remains below 0.7240, the risk will be towards the downside. Technically, the daily chart shows that the price extended its decline below its 20 SMA, while the technical indicators head sharply lower well below their mid-lines, in line with further declines. In the 4 hours chart, the price is below its 200 EMA, while the Momentum indicator maintains a bearish slope below its 100 level and the RSI consolidates near oversold readings, all of which supports the longer term outlook.
Support levels: 0.7170 0.7135 0.7100
Resistance levels: 0.7200 0.7240 0.7285
-------
What will 2016 bring to the Forex traders? Attend our event, Forex Forecast 2016 - The Panel with Ashraf Laidi, Valeria Bednarik, Boris Schlossberg, Adam Button, Ivan Delgado and Dale Pinkert. Register for the live event on Dec. 18th and get the recording too.
-------
Information on these pages contains forward-looking statements that involve risks and uncertainties. Markets and instruments profiled on this page are for informational purposes only and should not in any way come across as a recommendation to buy or sell in these assets. You should do your own thorough research before making any investment decisions. FXStreet does not in any way guarantee that this information is free from mistakes, errors, or material misstatements. It also does not guarantee that this information is of a timely nature. Investing in Open Markets involves a great deal of risk, including the loss of all or a portion of your investment, as well as emotional distress. All risks, losses and costs associated with investing, including total loss of principal, are your responsibility. The views and opinions expressed in this article are those of the authors and do not necessarily reflect the official policy or position of FXStreet nor its advertisers. The author will not be held responsible for information that is found at the end of links posted on this page.
If not otherwise explicitly mentioned in the body of the article, at the time of writing, the author has no position in any stock mentioned in this article and no business relationship with any company mentioned. The author has not received compensation for writing this article, other than from FXStreet.
FXStreet and the author do not provide personalized recommendations. The author makes no representations as to the accuracy, completeness, or suitability of this information. FXStreet and the author will not be liable for any errors, omissions or any losses, injuries or damages arising from this information and its display or use. Errors and omissions excepted.
The author and FXStreet are not registered investment advisors and nothing in this article is intended to be investment advice.
Recommended Content
Editors’ Picks
AUD/USD defends 0.6400 after Chinese data dump

AUD/USD has found fresh buyers near 0.6400, hanging near YTD lows after strong China's Q1 GDP data. However, the further upside appears elusive amid weak Chinese activity data and sustained US Dollar demand. Focus shifts to US data, Fedspeak.
USD/JPY stands tall near multi-decade high near 154.50

USD/JPY keeps its range near multi-decade highs of 154.45 in the Asian session on Tuesday. The hawkish Fed expectations overshadow the BoJ's uncertain rate outlook and underpin the US Dollar at the Japanese Yen's expense. The pair stands resilient to the Japanese verbal intervention.
Gold: Buyers take a breather below $2,400 amid easing geopolitical tensions

Gold price is catching a breath below $2,400 in Asian trading on Tuesday, having risen over 1% in the US last session even on a solid US Retail Sales report, which powered the US Dollar through the roof. Easing Middle East geopolitical tensions and strong Chinese data could cap Gold's upside.
SOL primed for a breakout as it completes a rounding bottom pattern

Solana price has conformed to the broader market crash, following in the steps of Bitcoin price that remains in the red below the $65,000 threshold. For SOL, however, the sensational altcoin could have a big move in store.
Israel-Iran military conflict views and takeaways

Iran's retaliatory strike on Israel is an escalation of Middle East tensions, but not necessarily a pre-cursor to broader regional conflict. Events over the past few weeks in the Middle East, more specifically this past weekend, reinforce that the global geopolitical landscape remains tense.
