EUR/USD Current price: 1.0772
View Live Chart for the EUR/USD
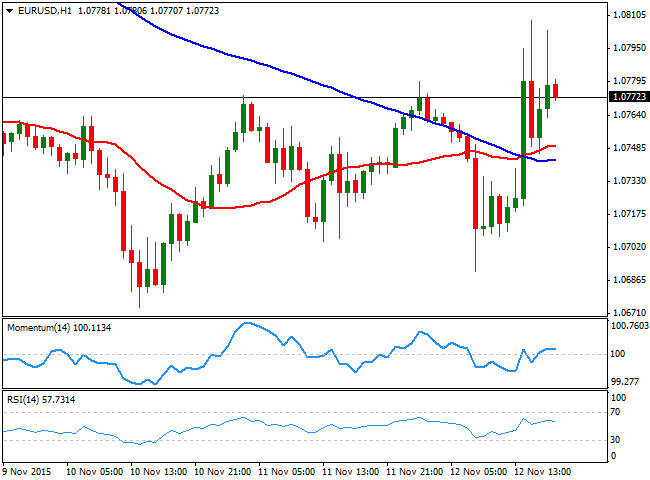
Central Banks' heads led the way for the EUR/USD pair this Thursday that anyway traded within its latest range. The common currency fell down to 1.0690 against its American counterpart in the European morning, following some comments from the ECB president, Mario Draghi, who pretty much guarantee an extension of QE next December, in his testimony on monetary policy, before the European Parliament. The greenback advanced across the board, until the US session opening, when plummeting stocks and a mute Yellen, who made no comments on economic policy, sent the pair to a fresh weekly high of 1.0808.The pair settled below the figure ahead of the close, showing little signs of having bottomed. In fact, the fundamental background that triggered the latest decline that is, the increasing imbalance between Central Banks, remains the same, which means that the risk is still towards the downside. The 1 hour chart shows that the price has managed to advance above its 20 and 100 SMAs, both around 1.0740/50, but that the technical indicators have lost their upward strength after crossing their mid-lines towards the upside. In the 4 hours chart, the price is still moving back and forth around a horizontal 20 SMA, while the technical indicators head higher above their mid-lines, mostly preventing the pair from falling in the short term, rather than signaling a continued advance.
Support levels: 1.0745 1.0690 1.0650
Resistance levels: 1.0810 1.0850 1.0890
EUR/JPY Current price: 132.30
View Live Chart for the EUR/JPY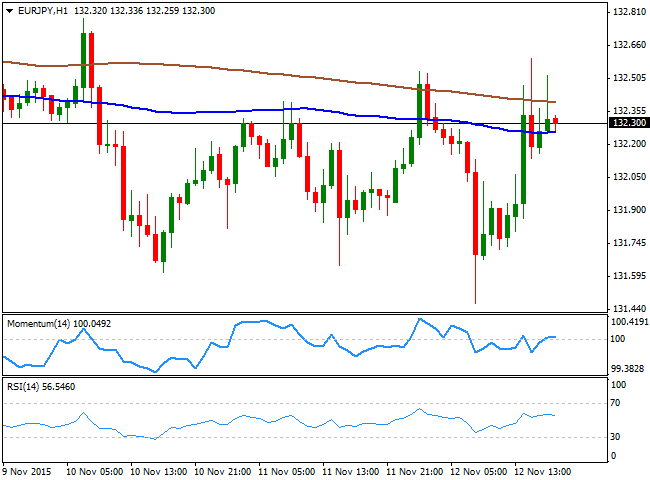
The EUR/JPY pair aims to close the day with some limited gains, having however, traded in its wider daily range for the week. Draghi's comments dragged the EUR lower in the London session, with the EUR/JPY down to 131.47, a fresh weekly low, from where it bounced up to 132.59. Choppy intraday trading did nothing to modify the ongoing neutral bias in the pair, as the 1 hour chart shows that the technical indicators have turned horizontal around their mid-lines, whilst the early advances beyond the 200 SMA were quickly reverted, and the price is now hovering around its 100 SMA. In the 4 hours chart, the technical indicators have advanced up to their mid-lines, where the recoveries stalled, while the price remains well below a sharply bearish 100 SMA, currently around 132.90, all of which continues to favor a bearish continuation for this last day of the week.
Support levels: 132.00 131.60 131.20
Resistance levels: 132.60 133.10 133.55
GBP/USD Current price: 1.5208
View Live Chart for the GPB/USD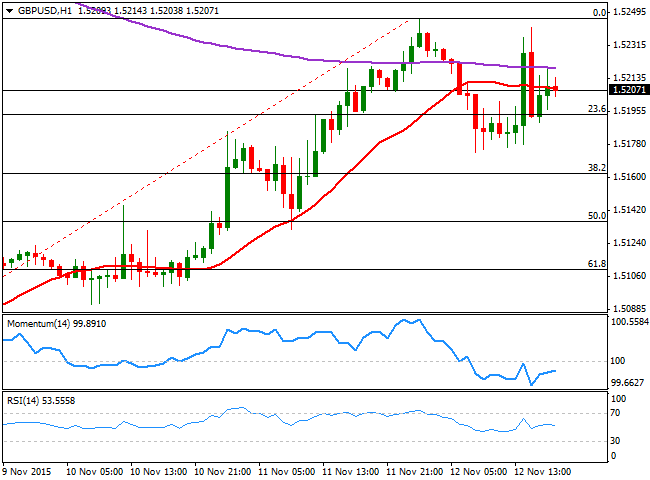
The GBP/USD pair advanced up to 1.5248 at the beginning of the day, favored by a broadly weaker dollar across the board. The pair however, retreated from that fresh weekly high in the European morning, driven by demand of the American currency after dovish ECB's president comments, falling down to 1.5173 ahead of the US opening. With no macroeconomic news coming from the UK, the pair traded purely on market's sentiment, towards the greenback, recovering back ahead of the 1.5200 level by the end of the day. Technically, the 1 hour chart shows that the price is hovering around a horizontal 20 SMA, whilst the technical indicators have turned flat around their mid-lines, lacking certain directional strength at the time being. In the 4 hours chart, the 20 SMA maintains a strong upward slope below the current price, whilst the technical indicators are resuming their advances well above their mid-lines, all of which increases chances of a bullish breakout for this Friday.
Support levels: 1.5195 1.5160 1.5135
Resistance levels: 1.5220 1.5250 1.5290
USD/JPY Current price: 122.81
View Live Chart for the USD/JPY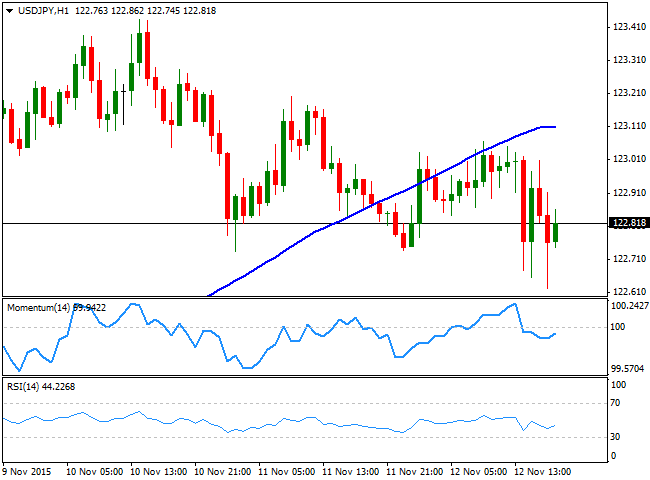
Despite trading in a tight range ever since the week started, a slightly negative trend is starting to emerge in the USD/JPY pair, which extended its decline down to 122.62 this Thursday. The Japanese yen has posted a discrete advance considering the sharp decline in worldwide stocks, but may play catch up after the upcoming Nikkei's opening. Technically, the 1 hour chart shows that the pair is slowly extending its decline below its 100 SMA for the first time since late October, whilst the technical indicators present tepid bearish slopes below their mid-lines, lacking momentum enough to confirm an imminent break lower. In the 4 hours chart, the price is consolidating near its low, but far above its moving averages, while the technical indicators head south below their mid-lines, supporting a bearish bias for this last day of the week.
Support levels: 122.80 122.50 122.20
Resistance levels: 123.10 123.45 123.80
AUD/USD Current price: 0.7119
View Live Chart for the AUD/USD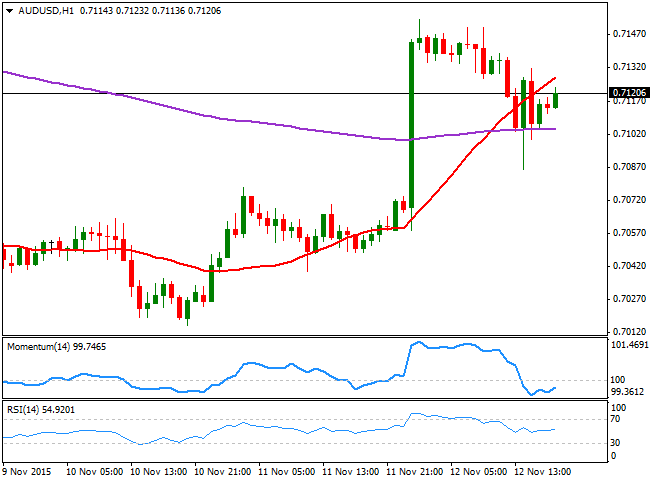
The Australian dollar soared against most of its rivals at the beginning of the day, following the release of Australian employment figures for October, showing that the economy managed to add 58,600 new jobs, almost four times more than expected, whilst the unemployment rate fell to 5.9% its lowest since April 2014. And while the market is still discussing whether those numbers are reliable, the AUD/USD pair added 100 pips right after the release, reaching a daily high 0.7153. An intraday dip met buying interest at 0.7086, and the pair is firmly above the 0.7100 level by the end of the US session, which suggests the upside is favored, at least in the short term. Technically, and according to the 1 hour chart, a bullish continuation is not yet confirmed, given that the price is below a bullish 20 SMA, whilst the RSI indicator is flat around 54 and the Momentum indicator aims higher, but below its 100 level. In the 4 hours chart, however, the upward seems more constructive, with the price recovering well above a bullish 20 SMA, and he technical indicators resuming their advances after a limited downward move well above their mid-lines.
Support levels: 0.7100 0.7070 0.7030
Resistance levels: 0.7150 0.7190 0.7240
Information on these pages contains forward-looking statements that involve risks and uncertainties. Markets and instruments profiled on this page are for informational purposes only and should not in any way come across as a recommendation to buy or sell in these assets. You should do your own thorough research before making any investment decisions. FXStreet does not in any way guarantee that this information is free from mistakes, errors, or material misstatements. It also does not guarantee that this information is of a timely nature. Investing in Open Markets involves a great deal of risk, including the loss of all or a portion of your investment, as well as emotional distress. All risks, losses and costs associated with investing, including total loss of principal, are your responsibility. The views and opinions expressed in this article are those of the authors and do not necessarily reflect the official policy or position of FXStreet nor its advertisers. The author will not be held responsible for information that is found at the end of links posted on this page.
If not otherwise explicitly mentioned in the body of the article, at the time of writing, the author has no position in any stock mentioned in this article and no business relationship with any company mentioned. The author has not received compensation for writing this article, other than from FXStreet.
FXStreet and the author do not provide personalized recommendations. The author makes no representations as to the accuracy, completeness, or suitability of this information. FXStreet and the author will not be liable for any errors, omissions or any losses, injuries or damages arising from this information and its display or use. Errors and omissions excepted.
The author and FXStreet are not registered investment advisors and nothing in this article is intended to be investment advice.
Recommended Content
Editors’ Picks
EUR/USD hovers around 1.0700 after German IFO data

EUR/USD stays in a consolidation phase at around 1.0700 in the European session on Wednesday. Upbeat IFO sentiment data from Germany helps the Euro hold its ground as market focus shifts to US Durable Goods Orders data.
USD/JPY refreshes 34-year high, attacks 155.00 as intervention risks loom

USD/JPY is renewing a multi-decade high, closing in on 155.00. Traders turn cautious on heightened risks of Japan's FX intervention. Broad US Dollar rebound aids the upside in the major. US Durable Goods data are next on tap.
Gold price trades with mild negative bias, manages to hold above $2,300 ahead of US data

Gold price (XAU/USD) edges lower during the early European session on Wednesday, albeit manages to hold its neck above the $2,300 mark and over a two-week low touched the previous day.
Worldcoin looks set for comeback despite Nvidia’s 22% crash Premium

Worldcoin price is in a better position than last week's and shows signs of a potential comeback. This development occurs amid the sharp decline in the valuation of the popular GPU manufacturer Nvidia.
Three fundamentals for the week: US GDP, BoJ and the Fed's favorite inflation gauge stand out Premium

While it is hard to predict when geopolitical news erupts, the level of tension is lower – allowing for key data to have its say. This week's US figures are set to shape the Federal Reserve's decision next week – and the Bank of Japan may struggle to halt the Yen's deterioration.
