EUR/USD Current price: 1.1210
View Live Chart for the EUR/USD
The dollar sold-off last Friday following the release of the US September employment figures, showing that the country added just 142,000 new jobs in the month, the worse so far this year, whilst wages saw no change during the same period, as average hourly earnings came in at 0.0% compared to the previous month. The data cast a shadow over a 2015 rate hike, fueling speculative selling of dollar's holdings. Nevertheless, the greenback met some critical levels against its most relevant counterparts that held, recovering most of the ground lost before the day was over, putting a longer term dollar-bear rally on hold.
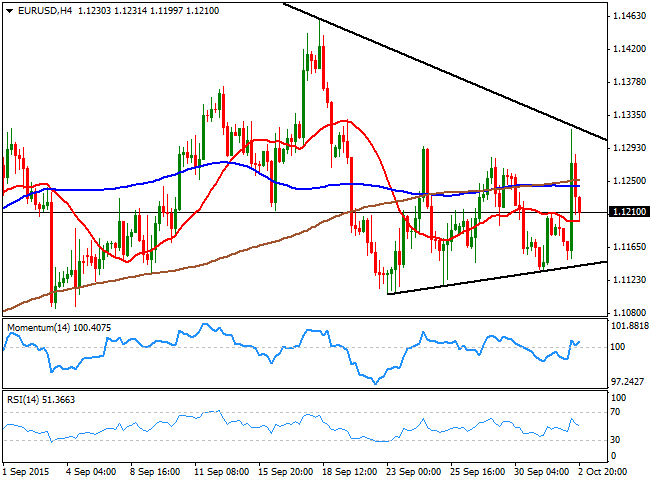
As for the EUR/USD pair, the price reached a weekly high of 1.1317 before pulling back some 100 pips to end the week around the 1.1200 figure, its comfort zone. Daily basis, the pair has been developing within a triangle and approaches to its vortex, diminishing the validity of the figure. On Friday, the pair tested both extremes of the figure, before settling midway, maintaining its latest range. In the same chart, the price is between its 20 and 100 SMAs, both horizontal, whilst the technical indicators are also flat, slightly below their mid-lines. In the 4 hours chart, the price is holding above its 20 SMA, but below its 100 and 200 SMAs, the Momentum indicator is aiming slightly higher from its 100 level, whilst the RSI indicator turned south around 51, all in line with the ongoing neutral technical stance. An upward continuation will be confirmed with a technical break above the 1.1320/30 price zone, where the pair met selling interest during the last two weeks.
Support levels: 1.1190 1.1155 1.1120
Resistance levels: 1.1245 1.1290 1.1335
EUR/JPY Current price: 134.40
View Live Chart for the EUR/JPY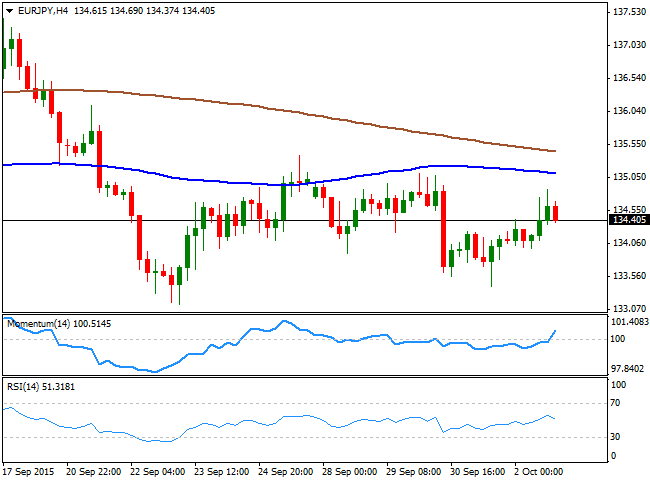
The EUR/JPY pair advanced some on Friday, but closed in the red for a third consecutive week, holding however, within early September range. The Japanese yen has seen temporal intraday demand after the US NFP release, but the pair held above the 134.00 figure, leading to a positive close. Technically, the daily chart shows that the pair ended the day a few pips below its 200 DMA, whilst the 100 SMA is turning lower around 136.60, and the technical indicators hold below their mid-lines, maintaining the risk towards the downside, despite the lack of directional momentum. In the 4 hours chart, the price is standing below its moving averages that maintain limited bearish slopes, whilst the technical indicators diverge from each other around their mid-lines. A steadier advance beyond 135.00 is required to confirm a bullish continuation, whilst below 134.00 the pair can retest the 133.30 price zone, the lows posted late September.
Support levels: 134.00 133.65 133.30
Resistance levels: 134.95 135.40 135.90
GBP/USD Current price: 1.5178
View Live Chart for the GPB/USD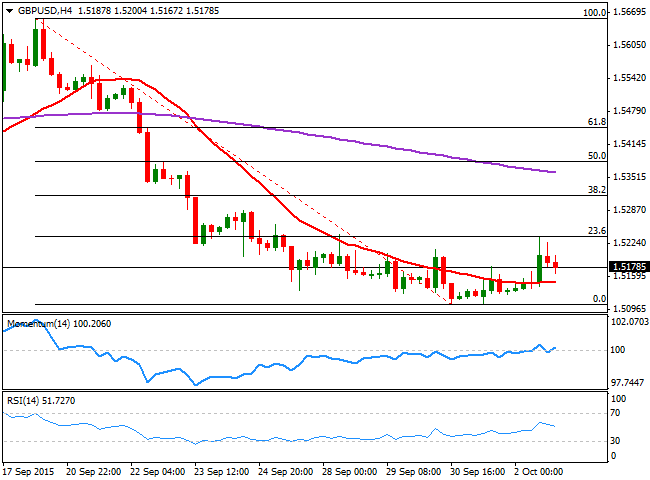
The GBP/USD pair posted a shallow advance on Friday, extending up to 1.5236, the 23.6% retracement of its latest decline measured between 1.5657, September 18th high and the low of the same month at 1.5106, but was unable to sustain its gains beyond the 1.5200 level, leaving the dominant bearish trend in place. Technically, the daily chart shows that the pair remains well below a bearish 20 SMA now hovering a few pips above the 38.2% retracement of the same rally in the 1.5330 price zone, whilst the Momentum indicator continues heading lower well below the 100 level and the RSI indicator has barely bounced from oversold levels. Shorter term, the 4 hours chart shows that the price is above a flat 20 SMA for the first time in two weeks, whilst the technical indicators lack directional strength in neutral territory. The pair needs to extend beyond the mentioned Fibonacci resistance to be able to extend its upward corrective movement, up to the 1.5300/40 price zone, yet a decline below 1.5125 will open doors for a break lower towards fresh multi-month lows.
Support levels: 1.5160 1.5125 1.5090
Resistance levels: 1.5235 1.5280 1.5320
USD/JPY Current price: 119.89
View Live Chart for the USD/JPY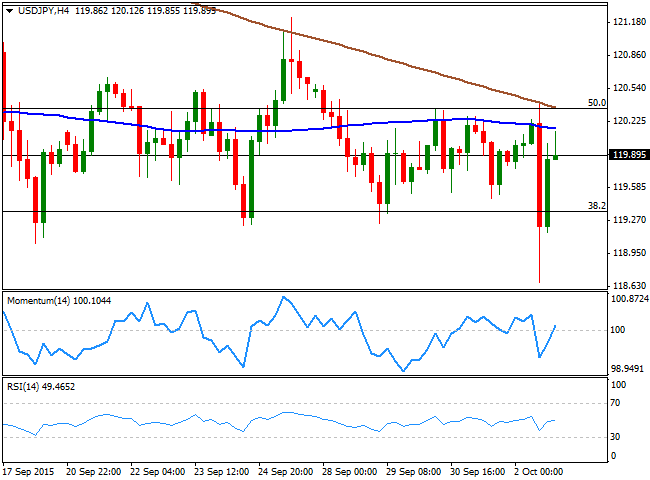
The USD/JPY pair ended the day flat and slightly below the 120.00 level, after trading as low as 118.67, its lowest in 4 weeks. The Japanese yen strengthened after the release of poor US employment figures for September, but changed bias following a strong recovery in US indexes. The pair has then, posted its fourth consecutive doji daily basis, a reflection of the ongoing market's uncertainty over the global economic developments. Technically however, the daily chart shows that the risk remains towards the downside, as the price remains well below its 100 and 200 SMAs, whilst the Momentum indicator presents a mild bearish slope in negative territory. Shorter term, the 4 hours chart shows that the pair presents a neutral-to-bearish stance, as the price is below its moving averages whilst the technical indicators lack directional strength around their mid-lines. The pair has been steadily trading between Fibonacci levels, with the immediate resistance now at 120.35, the 50% retracement of its latest weekly decline.
Support levels: 119.60 119.35 118.90
Resistance levels: 120.35 120.70 121.10
AUD/USD Current price: 0.7053
View Live Chart for the AUD/USD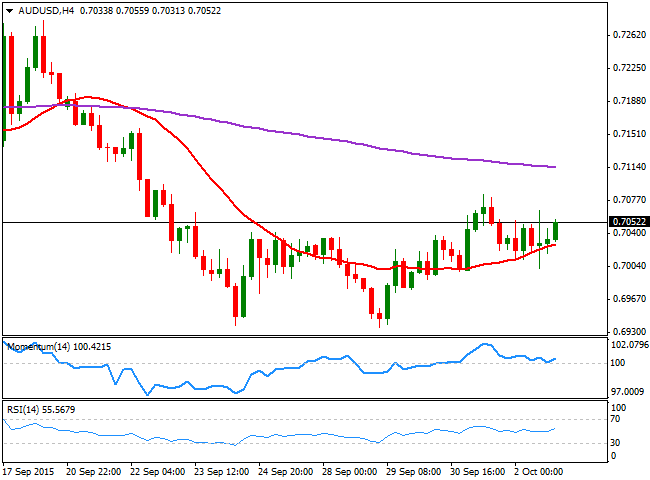
Commodity currencies were the best performers last Friday, holding to its daily gains amid a steady recovery in gold and oil prices. The Australian dollar advanced up to 0.7066 against its American rival, and closed the day a few pips below it, presenting a limited upward potential, given that in the daily chart, the price is still below a horizontal 20 SMA, whilst the Momentum indicator heads lower below the 100 level and the RSI indicator hovers around 46 level. In the 4 hours chart the 20 SMA heads higher below the current price, acting as a dynamic intraday support around 0.7030, while the technical indicators are posting tepid advances above their mid-lines, all of which should maintain the downside limited, at least in the short term. Nevertheless, a break below the 0.7000 level will likely signal a continued decline towards the lower range of 0.6900.
Support levels: 0.7030 0.7000 0.6955
Resistance levels: 0.7075 0.7110 0.7140
Information on these pages contains forward-looking statements that involve risks and uncertainties. Markets and instruments profiled on this page are for informational purposes only and should not in any way come across as a recommendation to buy or sell in these assets. You should do your own thorough research before making any investment decisions. FXStreet does not in any way guarantee that this information is free from mistakes, errors, or material misstatements. It also does not guarantee that this information is of a timely nature. Investing in Open Markets involves a great deal of risk, including the loss of all or a portion of your investment, as well as emotional distress. All risks, losses and costs associated with investing, including total loss of principal, are your responsibility. The views and opinions expressed in this article are those of the authors and do not necessarily reflect the official policy or position of FXStreet nor its advertisers. The author will not be held responsible for information that is found at the end of links posted on this page.
If not otherwise explicitly mentioned in the body of the article, at the time of writing, the author has no position in any stock mentioned in this article and no business relationship with any company mentioned. The author has not received compensation for writing this article, other than from FXStreet.
FXStreet and the author do not provide personalized recommendations. The author makes no representations as to the accuracy, completeness, or suitability of this information. FXStreet and the author will not be liable for any errors, omissions or any losses, injuries or damages arising from this information and its display or use. Errors and omissions excepted.
The author and FXStreet are not registered investment advisors and nothing in this article is intended to be investment advice.
Recommended Content
Editors’ Picks
EUR/USD consolidates gains below 1.0700 amid upbeat mood

EUR/USD is consolidating its recovery below 1.0700 in the European session on Thursday. The US Dollar holds its corrective decline amid improving market mood, despite looming Middle East geopolitical risks. Speeches from ECB and Fed officials remain on tap.
GBP/USD clings to moderate gains above 1.2450 on US Dollar weakness

GBP/USD is clinging to recovery gains above 1.2450 in European trading on Thursday. The pair stays supported by a sustained US Dollar weakness alongside the US Treasury bond yields. Risk appetite also underpins the higher-yielding currency pair. ahead of mid-tier US data and Fedspeak.
Gold price shines amid fears of fresh escalation in Middle East tensions

Gold price rebounds to $2,380 in Thursday’s European session after posting losses on Wednesday. The precious metal holds gains amid fears that Middle East tensions could worsen and spread beyond Gaza if Israel responds brutally to Iran.
Ripple faces significant correction as former SEC litigator says lawsuit could make it to Supreme Court

Ripple (XRP) price hovers below the key $0.50 level on Thursday after failing at another attempt to break and close above the resistance for the fourth day in a row.
Have we seen the extent of the Fed rate repricing?

Markets have been mostly consolidating recent moves into Thursday. We’ve seen some profit taking on Dollar longs and renewed demand for US equities into the dip. Whether or not this holds up is a completely different story.