Orbex would like to introduce our first Elliot Wave analysis where our resident analyst looks at the current WTI cycle.
The WTI (Crude Oil) cycle and current Wave Count is indicating that the up-side movement may not be over yet, and that WTI could reach as high as $70 or even $80 per barrel, in the long run.
Before that may occur, the Wave Count below is suggesting that WTI could show more weakness, possibly towards the previous Bullish Break-out around $54-52 levels.
WTI – Daily Chart:
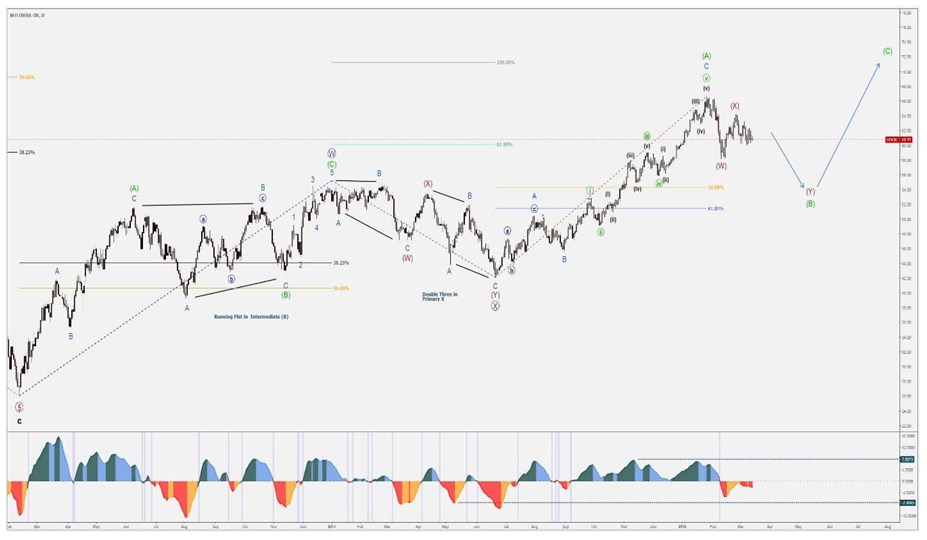
Elliott Wave Long-Term Analysis:
- 11th Feb 2016 low and 3rd Jan 2017 high – These Swings are labeled as Primary W (purple), due to the Complex Patterns and false break-outs noticeable within Intermediate (B) (green).
- 3rd Jan 2017 high and 21st Jun 2017 low – The Complex Corrective Structure is labeled as a Double Three, within Primary X (purple).
- 21st Jun 2017 low until present times – Price Action Rally is labeled as Intermediate (A) (green), with the sustained Rally occurring in Minor C (light blue).
WTI – 4H Chart:
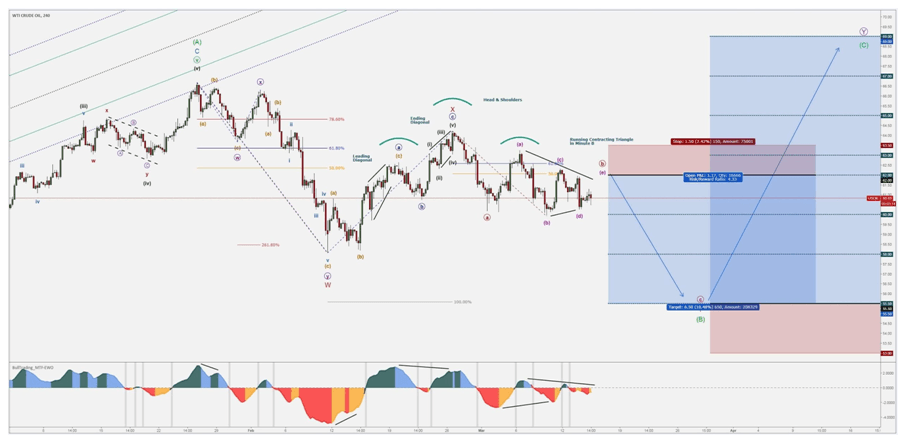
The overall Structure is labeled as a possible Double Three in Intermediate (B) (green) which is showing considerable signs of possible Bearish candles before the Bullish Cycle would be completed.
Elliott Wave Medium-Term Analysis:
- 25th Jan 2018 high and 9th Feb 2018 low – First leg of the projected Double Three Structure, representing Minor W (red), showing a failed Bullish Retracement in Minute X (purple) and an Extension in Bearish Minor Y (purple).
- 9th Feb 2018 low and 26th Feb high – Second leg, viewed as a temporary interruption and as Minor X (red), containing a Leading Diagonal in Minute A (blue) and an Ending Diagonal in Minute C (blue).
- 26th Feb high until present day – Corrective Pattern presents a conflict of degrees and the attempt to correct previous Corrective Structure, hence the reason for the very possible Running Contracting Triangle scenario.
WTI – Running Contracting Triangle Analysis:
- Minute A (red) unfolded with a 5 Swings Sequence, which could indicate that the short-term down-trend could not be over.
- Minute B (red) seems to be unfolding within a Running Contracting Triangle, with Minuette (b) (pink) pushing beyond the start of Minuette (a) (pink).
- Should this scenario be the correct one, Minuette (e) (pink) would complete at or slightly beyond the upper contracting trend-line, not higher than the start of Minuette (a) (pink).
*Other Technical Patterns: possible Head & Shoulders Formation.
WTI – Levels in Focus:
Bearish Scenario:
- 62.00 with Invalidation @ 63.50
- Projected Levels – 60.00 / 58.00 / 55.50
Bullish Scenario:
- 55.50 with Invalidation @ 53.00
- Projected Levels – 58.00 / 60.00 / 63.00 / 65.00 / 67.00 / 69.00
*The present analysis is to be treated as market research and does not constitute investment advice or as a solicitation to trade. Please be aware of the real risk involved by trading financial instruments.
This market forecast is for general information only. It is not an investment advice or a solution to buy or sell securities.
Authors' opinions do not represent the ones of Orbex and its associates. Terms and Conditions and the Privacy Policy apply.
Trading foreign exchange on margin carries a high level of risk, and may not be suitable for all investors. Before deciding to trade foreign exchange, you should carefully consider your investment objectives, level of experience, and risk appetite. There is a possibility that you may sustain a loss of some or all of your investment and therefore you should not invest money that you cannot afford to lose. You should be aware of all the risks associated with foreign exchange trading, and seek advice from an independent financial advisor if you have any doubts.
Recommended Content
Editors’ Picks
AUD/USD could extend the recovery to 0.6500 and above

The enhanced risk appetite and the weakening of the Greenback enabled AUD/USD to build on the promising start to the week and trade closer to the key barrier at 0.6500 the figure ahead of key inflation figures in Australia.
EUR/USD now refocuses on the 200-day SMA

EUR/USD extended its positive momentum and rose above the 1.0700 yardstick, driven by the intense PMI-led retracement in the US Dollar as well as a prevailing risk-friendly environment in the FX universe.
Gold struggles around $2,325 despite broad US Dollar’s weakness

Gold reversed its direction and rose to the $2,320 area, erasing a large portion of its daily losses in the process. The benchmark 10-year US Treasury bond yield stays in the red below 4.6% following the weak US PMI data and supports XAU/USD.
Bitcoin price makes run for previous cycle highs as Morgan Stanley pushes BTC ETF exposure

Bitcoin (BTC) price strength continues to grow, three days after the fourth halving. Optimism continues to abound in the market as Bitcoiners envision a reclamation of previous cycle highs.
US versus the Eurozone: Inflation divergence causes monetary desynchronization

Historically there is a very close correlation between changes in US Treasury yields and German Bund yields. This is relevant at the current juncture, considering that the recent hawkish twist in the tone of the Federal Reserve might continue to push US long-term interest rates higher and put upward pressure on bond yields in the Eurozone.