![]() Nadia Simmons
Nadia Simmons
Sunshine Profits
The oil bull still managed to score another day of gains yesterday. A meager advance but still an advance, one could say. And be forgiven, as they would not have had examined the full picture. Are we just teasing you now? Come on, there can’t be possibly more to the story... There is. The scenario that we wrote about exactly to the day two weeks ago, has come to fruition. The implications are far-reaching. Time to share.
Let’s take a closer look at the charts below (charts courtesy of http://stockcharts.com).
Yesterday, we wrote the following about Wednesday’s session:
(…) Yesterday’s session brought us another day of crude oil price gains, marking a fresh March peak. While not minuscule, the accompanying volume was still lower than the day before. The jury is still out but we lean towards the bearish implications thereof.
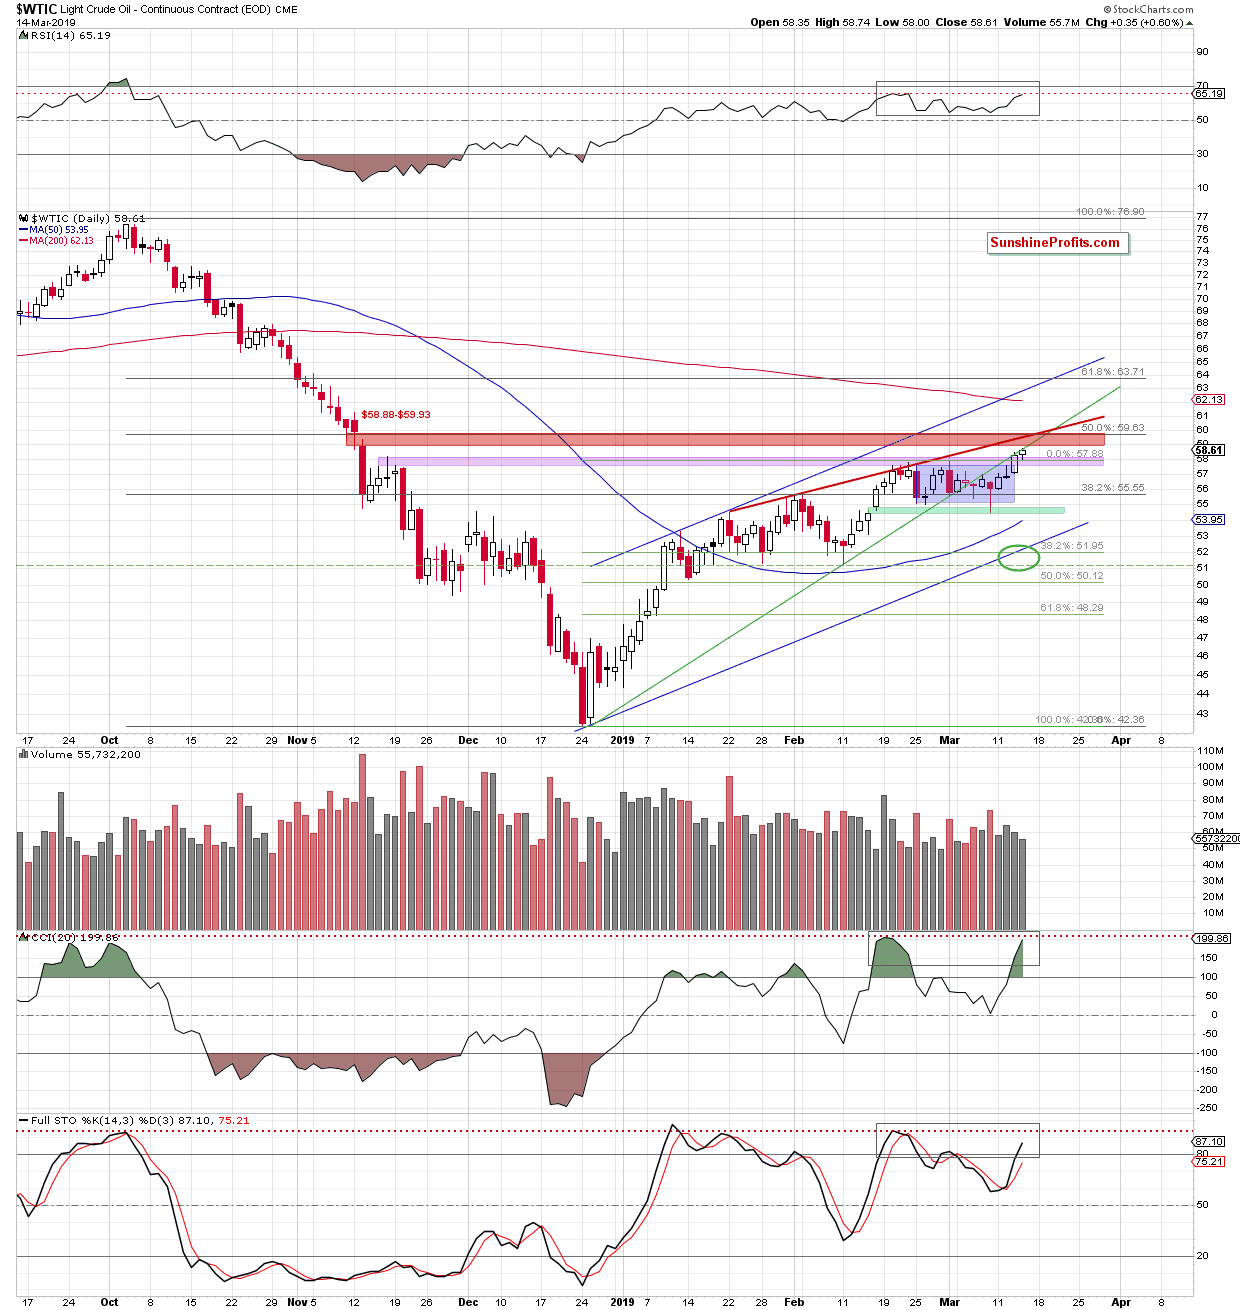
Take a good look at yesterday’s candle. While it is yet another close higher, it was made on an even lower volume than the day before. This tips the scales ever more subtly in the favor of the bears – just like the fact that the body of yesterday’s candle was smaller than the Wednesday’s one.
Such price compression is a telling clue of a strong undercurrent at play. That is, the proximity of strong resistances nearby:the previously broken rising green support line and the rising red resistance line. Yesterday’s close was yet another close below both of them. All in all, this increases the likelihood of an upcoming downward price reversal.
Additionally, there are clearly visible bearish divergences being formed between the RSI, the CCI, the Stochastic Oscillator and the price of black gold (we marked them with grey rectangles on the above chart). It’s only the downward price move that is missing to complete them for all to see.
All the above doesn’t bode well for the oil bulls’ strength and increases doubts about the space for further improvement. Do you remember when we discussed the Elliott Wave perspective on March 1st? We’ve mentioned the very real possibility of the 5th wave higher, its target namely. Let’s bring up the chart updated with recent price development and quote our thoughts from the March 1st Alert:
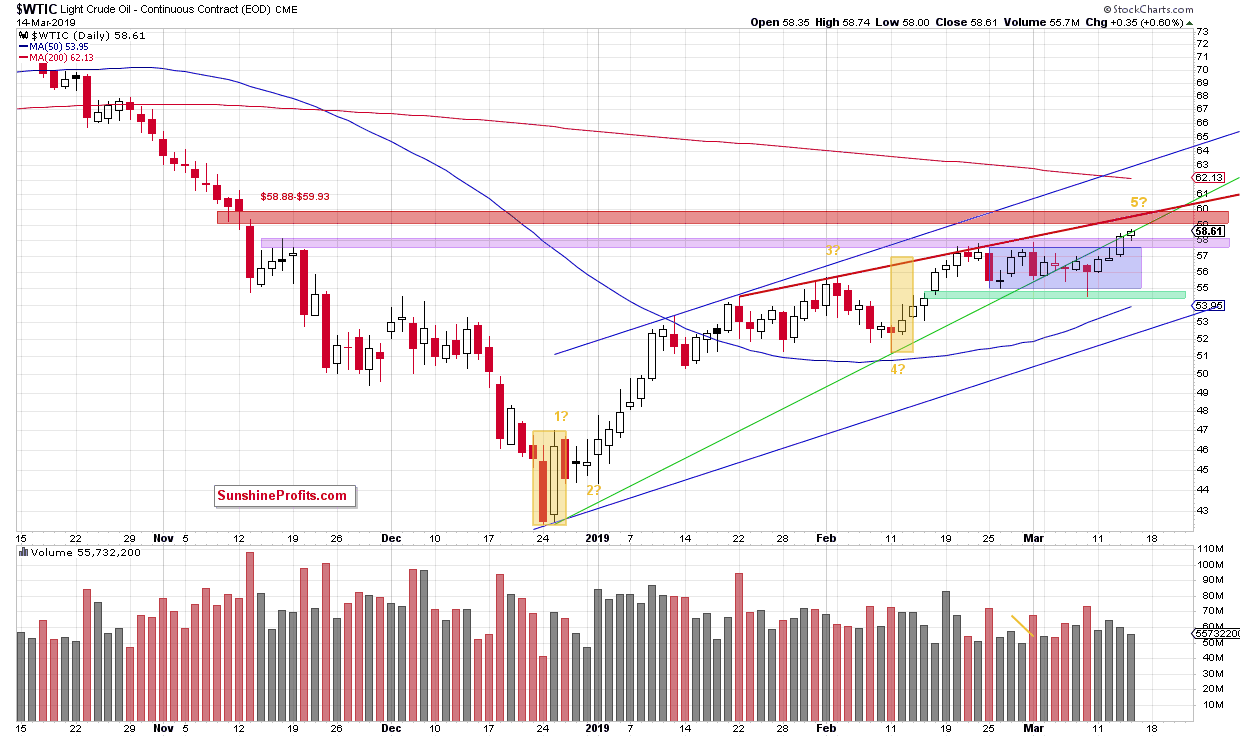
(…) Note the two yellow rectangles which show that the upward move between the February 11 low and the last week’s peaks was quite similar to the first upward move after the December low.
Such price action suggests that we could observe the last impulse wave according to the Elliott Wave Theory. It says that the first and the fifth waves are quite similar (in our case not in time, but probably in the length). If this is the case, crude oil can still hit one more fresh peak, which will precede a bigger move to the downside.
Why is another fresh high possible?
If we correctly marked the waves of the upward December-February move, light crude is currently forming the fifth smaller wave within a bigger fifth (marked on the above chart with 5?) wave. In other words, if all the above assumptions are correct, the last peak is still ahead of us. One more note regarding the markings and assumptions – within Elliott Wave Theory, the wave counts and markings can change as the chart progresses to be in line with the underlying price action. The market decides – the waves structure, type and precedence of waves.
How high can the commodity go?
Light crude can test the above-mentioned red resistance line, which currently intersects the upper border of the purple resistance zone. Here, the size of the fifth impulse wave would be equal to 150% of the first wave. Nevertheless, if this area is broken, the next target would be around $58.74, where the fifth wave would be equal to 161.8% of the first wave, which is slightly below the red gap.
What could happen next?
In our opinion, after a potential fresh peak, we’ll still see a drop to at least the green support line based on December and February lows, but it seems more likely to us that we’ll see a decline to around $51.23-$52.30, where the mid-February lows and the bottom of a potential fourth wave are.
Before we summarize today’s Alert, please check what was yesterday’s intraday high… yes, $58.74 exactly.
On top, we’re seeing the first bear raid just now. Probing bulls’ defenses, crude oil currently trades at around $58.10 – fully erasing yesterday’s gains within a couple of hours, still before the U.S. session opens.
Summing up, short position in crude oil continues to be justified from the risk/reward perspective as crude oil has reached very important resistance levels. Combined with the progressively declining volume during recent increases, bearish divergences between the indicators and the commodity itself, and clearly visible oil bulls’ problem overcoming the previously broken green support-turned-resistance line increases the probability of a bigger move to the downside in the coming week.
All essays, research and information found above represent analyses and opinions of Przemyslaw Radomski, CFA and Sunshine Profits' employees and associates only. As such, it may prove wrong and be a subject to change without notice. Opinions and analyses were based on data available to authors of respective essays at the time of writing. Although the information provided above is based on careful research and sources that are believed to be accurate, Przemyslaw Radomski, CFA and his associates do not guarantee the accuracy or thoroughness of the data or information reported. The opinions published above are neither an offer nor a recommendation to purchase or sell any securities. Mr. Radomski is not a Registered Securities Advisor. By reading Przemyslaw Radomski's, CFA reports you fully agree that he will not be held responsible or liable for any decisions you make regarding any information provided in these reports. Investing, trading and speculation in any financial markets may involve high risk of loss. Przemyslaw Radomski, CFA, Sunshine Profits' employees and affiliates as well as members of their families may have a short or long position in any securities, including those mentioned in any of the reports or essays, and may make additional purchases and/or sales of those securities without notice.
Recommended Content
Editors’ Picks
EUR/USD climbs to 10-day highs above 1.0700

EUR/USD gained traction and rose to its highest level in over a week above 1.0700 in the American session on Tuesday. The renewed US Dollar weakness following the disappointing PMI data helps the pair stretch higher.
GBP/USD extends recovery beyond 1.2400 on broad USD weakness

GBP/USD gathered bullish momentum and extended its daily rebound toward 1.2450 in the second half of the day. The US Dollar came under heavy selling pressure after weaker-than-forecast PMI data and fueled the pair's rally.
Gold struggles around $2,325 despite broad US Dollar’s weakness

Gold reversed its direction and rose to the $2,320 area, erasing a large portion of its daily losses in the process. The benchmark 10-year US Treasury bond yield stays in the red below 4.6% following the weak US PMI data and supports XAU/USD.
Here’s why Ondo price hit new ATH amid bearish market outlook Premium

Ondo price shows no signs of slowing down after setting up an all-time high (ATH) at $1.05 on March 31. This development is likely to be followed by a correction and ATH but not necessarily in that order.
Germany’s economic come back

Germany is the sick man of Europe no more. Thanks to its service sector, it now appears that it will exit recession, and the economic future could be bright. The PMI data for April surprised on the upside for Germany, led by the service sector.