![]() Wells Fargo Research Team
Wells Fargo Research Team
Wells Fargo
Executive Summary: A Group of Black Swans Create Their Own Path
While we are just beginning to see the economic impacts of COVID-19 appear in the data, it is clear that what we will see in the coming months will be truly unprecedented. Few analysts were forecasting a recession coming into the year and even fewer anticipated that we would combat a pandemic in 2020. In many respects, this highly improbable but impactful event meets the criteria of a Black Swan.1 While we are likely to see large swings in a number of indicators over the coming months, only some may return to their pre-crisis trend. In this report, we raise the question of whether the COVID-19 is a black swan or a group of black swans. While one can look at COVID-19 as a singular economic shock, its longer-term implications for different sectors of the economy may vary.
We illustrate these heterogeneous effects by looking back to the Great Recession, when the economy faced another high-impact, low-probability shock. Virtually all sectors saw historically significant swings in 2008 and 2009, but only some returned to their pre-crisis trend in the post- Great Recession era. It is too soon to know what long lasting impacts COVID-19 will have on macroeconomic statistics, but for those attempting to model the economy, it is vital to anticipate these potential trend changes.
A Black Swan vs. A Group of Black Swans: Which is Worse?
Both a black swan and a group of black swans are highly improbable events with a significant impact on the economy, but they differ in their aftermath. The difference between these two terms has significant implications for decision making as well as for modeling and forecasting.2 As we watch the unprecedented economic impacts of the COVID-19 pandemic, it is important to distinguish the overarching event from its potentially heterogeneous effects on various parts of the economy. Looking back to the Great Recession can provide useful insights into how a large shock can have varying effects on different sectors of the economy.
The ISM manufacturing index experienced a sharp decline in the Great Recession, falling 34% from its pre-recession peak in November 2007 to its trough in December 2008. The index bounced back relatively quickly, however, and crossed back into expansion eight months later (Figure 1). Industrial production (IP) also dropped considerably during the crisis. While it did not recover as quickly as the ISM index, it did return to its pre-crisis trend. This was not true for all variables, however.
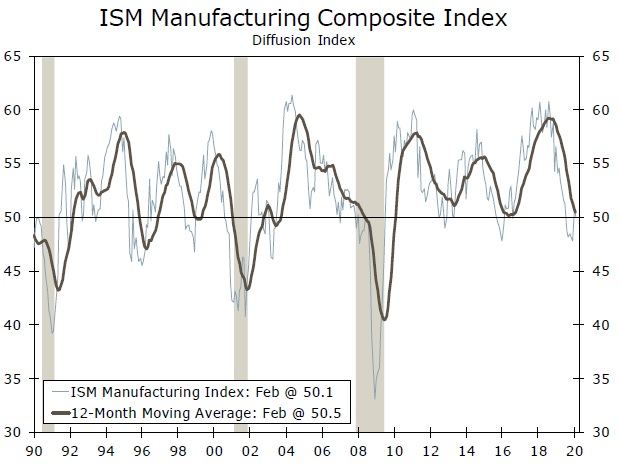
Source: Federal Reserve Board, Institute for Supply Management and Wells Fargo Securities
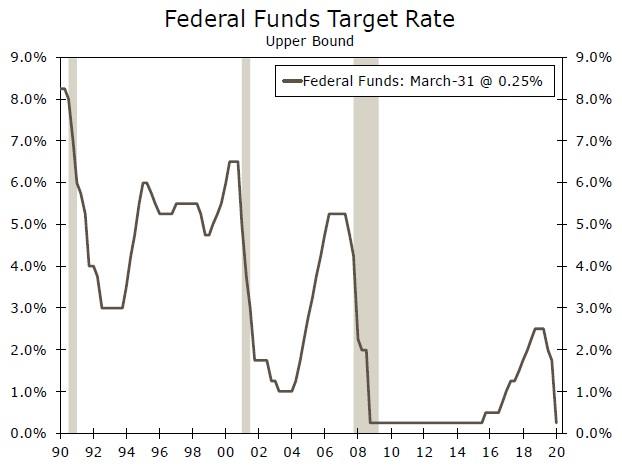
The extraordinary path of monetary policy during the crisis and the subsequent recovery left the Fed funds rate (FFR) far below its pre-recession peak throughout the post Great Recession era (Figure 2). Moreover, failing to regain the previous peak wasn't the only ‘unusual path' taken by the FFR. The overall behavior of the FFR was different than the past recessions and recoveries. The FFR was on pause from December 2008 to December 2015—the longest duration of no-change in the FFR as far back as data are available (effective fed funds goes back to the 1950s). When the FOMC eventually began to raise rates, it was the slowest pace of rate hikes in decades. The FOMC also engaged in several rounds of quantitative easing, which took the Fed's balance sheet to over $4 trillion. The unprecedented measures taken by the FOMC were necessary to stimulate the fledgling recovery, but they undoubtedly changed how we interpret changes in the FFR in our economic and financial models.
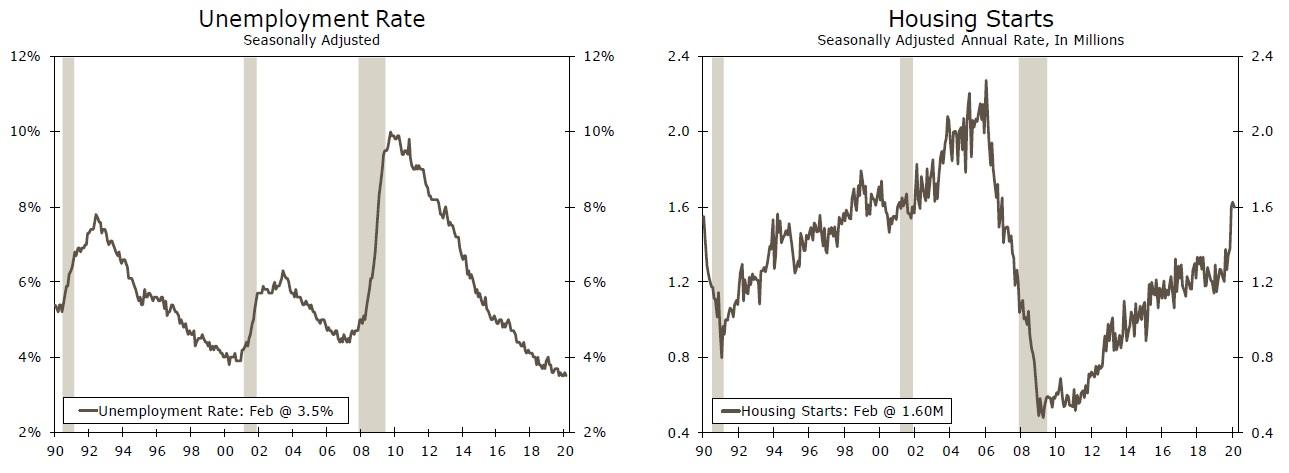
Of course, monetary policy was not the only area that the Great Recession affected in this manner. The unemployment rate (a proxy for the labor market) and housing starts (a proxy for the housing sector) also fell into the group of black swans in the Great Recession. The length of time for the peak unemployment rate to recover to its previous trough was 60 months after the 1991 recession and 43 months following the 2001 recession, but a whopping 91 months after the Great Recession (Figure 3). Housing starts also exhibited different behavior after the Great Recession. In fact, housing starts have yet to reach their pre-recession levels in the post Great Recession era (Figure 4). Furthermore, housing starts stayed above one million units in the 1992-2007 period but dropped below this level from July 2008 until December 2012.
Expecting these areas would go ‘back-to-normal' after the Great Recession could have led to misguided models and biased forecasts. IP and the ISM manufacturing index followed their prerecession pattern, but housing starts and many other indicators took a different path. The unemployment rate took longer than expected to get back to ‘normal.' The biggest surprise was that monetary policy was in a completely different universe.
By the same token, whether COVID-19 is a black swan or a group of black swans for some sectors is unknown. How long will it take to contain COVID-19? What will be the ultimate depth or duration of the damages to the economy? Obviously, these are extremely difficult to predict and that is why COVID-19 may be classified in family of black swans. However, based on our experience from the Great Recession, one cannot assume everything will go back to normal. A better approach is to monitor the upcoming data to gauge which sector shows signs of a black swan (going back to the pre-shock trend/behavior) and what sectors exhibit characteristics of a group of black swans.
Source: U.S. Department of Labor, Wells Fargo Securities
Forecasting Implications of a Group of Black Swans: Don't Live in the Past
Our past work highlights our modeling and forecasting experience after the Great Recession.3 For some models such as IP and the ISM index, we re-calibrated parameters to incorporate the Great Recession break but most of the inputs were the same, as these sectors followed the similar trends/behavior after the recession. Others models required new inputs (new predictors in addition to new parameters), such as nonfarm payrolls and housing starts in order to capture the new, postgreat recession patterns. Finally, some variable lost their predictive power. The constant Fed funds rate from December 2008 to December 2015 provided little predictive insights for other areas of the economy that continued to fluctuate.
Thus, we strongly suggest that analysts who are interested in modeling and forecasting to go back to the drawing board after the COVID-19 outbreak and re-build models. We are planning to do the same.
Conclusion: COVID-19 May Alter Some Sectors' Trend
Based on our experience after the Great Recession, we plan to carefully monitor the upcoming data to gauge signs of changes in the trends and behavior of underlying variables. Because COVID-19 has already disrupted the global economy and pushed policymakers to announce some of the largest stimulus packages that we have ever seen, we cannot be sure that everything will return to ‘normal.'
Recently, the stock market has experienced high levels of volatility. If you are thinking about participating in fast moving markets, please take the time to read the information below. Wells Fargo Investments, LLC will not be restricting trading on fast moving securities, but you should understand that there can be significant additional risks to trading in a fast market. We've tried to outline the issues so you can better understand the potential risks. If you're unsure about the risks of a fast market and how they may affect a particular trade you've considering, you may want to place your trade through a phone agent at 1-800-TRADERS. The agent can explain the difference between market and limit orders and answer any questions you may have about trading in volatile markets. Higher Margin Maintenance Requirements on Volatile Issues The wide swings in intra-day trading have also necessitated higher margin maintenance requirements for certain stocks, specifically Internet, e-commerce and high-tech issues. Due to their high volatility, some of these stocks will have an initial and a maintenance requirement of up to 70%. Stocks are added to this list daily based on market conditions. Please call 1-800-TRADERS to check whether a particular stock has a higher margin maintenance requirement. Please note: this higher margin requirement applies to both new purchases and current holdings. A change in the margin requirement for a current holding may result in a margin maintenance call on your account. Fast Markets A fast market is characterized by heavy trading and highly volatile prices. These markets are often the result of an imbalance of trade orders, for example: all "buys" and no "sells." Many kinds of events can trigger a fast market, for example a highly anticipated Initial Public Offering (IPO), an important company news announcement or an analyst recommendation. Remember, fast market conditions can affect your trades regardless of whether they are placed with an agent, over the internet or on a touch tone telephone system. In Fast Markets service response and account access times may vary due to market conditions, systems performance, and other factors. Potential Risks in a Fast Market "Real-time" Price Quotes May Not be Accurate Prices and trades move so quickly in a fast market that there can be significant price differences between the quotes you receive one moment and the next. Even "real-time quotes" can be far behind what is currently happening in the market. The size of a quote, meaning the number of shares available at a particular price, may change just as quickly. A real-time quote for a fast moving stock may be more indicative of what has already occurred in the market rather than the price you will receive. Your Execution Price and Orders Ahead In a fast market, orders are submitted to market makers and specialists at such a rapid pace, that a backlog builds up which can create significant delays. Market makers may execute orders manually or reduce size guarantees during periods of volatility. When you place a market order, your order is executed on a first-come first-serve basis. This means if there are orders ahead of yours, those orders will be executed first. The execution of orders ahead of yours can significantly affect your execution price. Your submitted market order cannot be changed or cancelled once the stock begins trading. Initial Public Offerings may be Volatile IPOs for some internet, e-commerce and high tech issues may be particularly volatile as they begin to trade in the secondary market. Customers should be aware that market orders for these new public companies are executed at the current market price, not the initial offering price. Market orders are executed fully and promptly, without regard to price and in a fast market this may result in an execution significantly different from the current price quoted for that security. Using a limit order can limit your risk of receiving an unexpected execution price. Large Orders in Fast Markets Large orders are often filled in smaller blocks. An order for 10,000 shares will sometimes be executed in two blocks of 5,000 shares each. In a fast market, when you place an order for 10,000 shares and the real-time market quote indicates there are 15,000 shares at 5, you would expect your order to execute at 5. In a fast market, with a backlog of orders, a real-time quote may not reflect the state of the market at the time your order is received by the market maker or specialist. Once the order is received, it is executed at the best prices available, depending on how many shares are offered at each price. Volatile markets may cause the market maker to reduce the size of guarantees. This could result in your large order being filled in unexpected smaller blocks and at significantly different prices. For example: an order for 10,000 shares could be filled as 2,500 shares at 5 and 7,500 shares at 10, even though you received a real-time quote indicating that 15,000 shares were available at 5. In this example, the market moved significantly from the time the "real-time" market quote was received and when the order was submitted. Online Trading and Duplicate Orders Because fast markets can cause significant delays in the execution of a trade, you may be tempted to cancel and resubmit your order. Please consider these delays before canceling or changing your market order, and then resubmitting it. There is a chance that your order may have already been executed, but due to delays at the exchange, not yet reported. When you cancel or change and then resubmit a market order in a fast market, you run the risk of having duplicate orders executed. Limit Orders Can Limit Risk A limit order establishes a "buy price" at the maximum you're willing to pay, or a "sell price" at the lowest you are willing to receive. Placing limit orders instead of market orders can reduce your risk of receiving an unexpected execution price. A limit order does not guarantee your order will be executed -" however, it does guarantee you will not pay a higher price than you expected. Telephone and Online Access During Volatile Markets During times of high market volatility, customers may experience delays with the Wells Fargo Online Brokerage web site or longer wait times when calling 1-800-TRADERS. It is possible that losses may be suffered due to difficulty in accessing accounts due to high internet traffic or extended wait times to speak to a telephone agent. Freeriding is Prohibited Freeriding is when you buy a security low and sell it high, during the same trading day, but use the proceeds of its sale to pay for the original purchase of the security. There is no prohibition against day trading, however you must avoid freeriding. To avoid freeriding, the funds for the original purchase of the security must come from a source other than the sale of the security. Freeriding violates Regulation T of the Federal Reserve Board concerning the extension of credit by the broker-dealer (Wells Fargo Investments, LLC) to its customers. The penalty requires that the customer's account be frozen for 90 days. Stop and Stop Limit Orders A stop is an order that becomes a market order once the security has traded through the stop price chosen. You are guaranteed to get an execution. For example, you place an order to buy at a stop of $50 which is above the current price of $45. If the price of the stock moves to or above the $50 stop price, the order becomes a market order and will execute at the current market price. Your trade will be executed above, below or at the $50 stop price. In a fast market, the execution price could be drastically different than the stop price. A "sell stop" is very similar. You own a stock with a current market price of $70 a share. You place a sell stop at $67. If the stock drops to $67 or less, the trade becomes a market order and your trade will be executed above, below or at the $67 stop price. In a fast market, the execution price could be drastically different than the stop price. A stop limit has two major differences from a stop order. With a stop limit, you are not guaranteed to get an execution. If you do get an execution on your trade, you are guaranteed to get your limit price or better. For example, you place an order to sell stock you own at a stop limit of $67. If the stock drops to $67 or less, the trade becomes a limit order and your trade will only be executed at $67 or better. Glossary All or None (AON) A stipulation of a buy or sell order which instructs the broker to either fill the whole order or don't fill it at all; but in the latter case, don't cancel it, as the broker would if the order were filled or killed. Day Order A buy or sell order that automatically expires if it is not executed during that trading session. Fill or Kill An order placed that must immediately be filled in its entirety or, if this is not possible, totally canceled. Good Til Canceled (GTC) An order to buy or sell which remains in effect until it is either executed or canceled (WellsTrade® accounts have set a limit of 60 days, after which we will automatically cancel the order). Immediate or Cancel An order condition that requires all or part of an order to be executed immediately. The part of the order that cannot be executed immediately is canceled. Limit Order An order to buy or sell a stated quantity of a security at a specified price or at a better price (higher for sales or lower for purchases). Maintenance Call A call from a broker demanding the deposit of cash or marginable securities to satisfy Regulation T requirements and/or the House Maintenance Requirement. This may happen when the customer's margin account balance falls below the minimum requirements due to market fluctuations or other activity. Margin Requirement Minimum amount that a client must deposit in the form of cash or eligible securities in a margin account as spelled out in Regulation T of the Federal Reserve Board. Reg. T requires a minimum of $2,000 or 50% of the purchase price of eligible securities bought on margin or 50% of the proceeds of short sales. Market Makers NASD member firms that buy and sell NASDAQ securities, at prices they display in NASDAQ, for their own account. There are currently over 500 firms that act as NASDAQ Market Makers. One of the major differences between the NASDAQ Stock Market and other major markets in the U.S. is NASDAQ's structure of competing Market Makers. Each Market Maker competes for customer order flow by displaying buy and sell quotations for a guaranteed number of shares. Once an order is received, the Market Maker will immediately purchase for or sell from its own inventory, or seek the other side of the trade until it is executed, often in a matter of seconds. Market Order An order to buy or sell a stated amount of a security at the best price available at the time the order is received in the trading marketplace. Specialists Specialist firms are those securities firms which hold seats on national securities exchanges and are charged with maintaining orderly markets in the securities in which they have exclusive franchises. They buy securities from investors who want to sell and sell when investors want to buy. Stop An order that becomes a market order once the security has traded through the designated stop price. Buy stops are entered above the current ask price. If the price moves to or above the stop price, the order becomes a market order and will be executed at the current market price. This price may be higher or lower than the stop price. Sell stops are entered below the current market price. If the price moves to or below the stop price, the order becomes a market order and will be executed at the current market price. Stop Limit An order that becomes a limit order once the security trades at the designated stop price. A stop limit order instructs a broker to buy or sell at a specific price or better, but only after a given stop price has been reached or passed. It is a combination of a stop order and a limit order. These articles are for information and education purposes only. You will need to evaluate the merits and risks associated with relying on any information provided. Although this article may provide information relating to approaches to investing or types of securities and investments you might buy or sell, Wells Fargo and its affiliates are not providing investment recommendations, advice, or endorsements. Data have been obtained from what are considered to be reliable sources; however, their accuracy, completeness, or reliability cannot be guaranteed. Wells Fargo makes no warranties and bears no liability for your use of this information. The information made available to you is not intended, and should not be construed as legal, tax, or investment advice, or a legal opinion.
Recommended Content
Editors’ Picks
EUR/USD hovers around 1.0700 after German IFO data

EUR/USD stays in a consolidation phase at around 1.0700 in the European session on Wednesday. Upbeat IFO sentiment data from Germany helps the Euro hold its ground as market focus shifts to US Durable Goods Orders data.
USD/JPY refreshes 34-year high, attacks 155.00 as intervention risks loom

USD/JPY is renewing a multi-decade high, closing in on 155.00. Traders turn cautious on heightened risks of Japan's FX intervention. Broad US Dollar rebound aids the upside in the major. US Durable Goods data are next on tap.
Gold price trades with mild negative bias, manages to hold above $2,300 ahead of US data

Gold price (XAU/USD) edges lower during the early European session on Wednesday, albeit manages to hold its neck above the $2,300 mark and over a two-week low touched the previous day.
Worldcoin looks set for comeback despite Nvidia’s 22% crash Premium

Worldcoin price is in a better position than last week's and shows signs of a potential comeback. This development occurs amid the sharp decline in the valuation of the popular GPU manufacturer Nvidia.
Three fundamentals for the week: US GDP, BoJ and the Fed's favorite inflation gauge stand out Premium

While it is hard to predict when geopolitical news erupts, the level of tension is lower – allowing for key data to have its say. This week's US figures are set to shape the Federal Reserve's decision next week – and the Bank of Japan may struggle to halt the Yen's deterioration.