![]() Matthew Ashley
Matthew Ashley
Blackwell Global Investments Limited
Key Points:
-
Falling wedge remains unbroken.
-
Stochastics hinting at a reversal.
-
Three drive could see a strong uptick in buying pressure.
The AUDNZD could be setting up for another push higher now that it has confirmed the downside of its medium-term chart pattern. However, it may be worth looking at some of the other technical data given the fundamental uncertainty surrounding the pair. Specifically, the recent quarterly contraction in the Australian GDP numbers and the surprise resignation of the NZ Prime Minister has both sides of the equation under pressure, leaving the pair somewhat exposed to technical biases.
First and foremost, the presence of the medium to long-term falling wedge pattern provides a good gauge of where we can expect to see the AUDNZD move to in the coming weeks. As a result of the pair’s recent failure to break through the downside, the intuition is that it must be making a push to the upside moving ahead. However, due to the strong bearish EMA bias and Parabolic SAR readings, there is some evidence to suggest that the AUDNZD could retest the downside and even break out. Fortunately, albeit only for the bulls, a number of other technical signals are providing evidence to the contrary which supports the intuitive forecast.
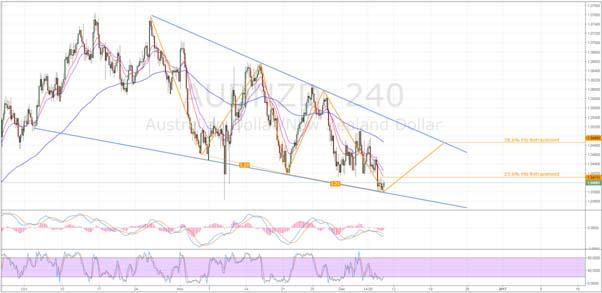
The first of these dissenting technical signals is the stochastic oscillator which is currently highly oversold. Consequently, we can expect chances of a downside breakout to be fairly remote in the absence of some highly disruptive economic news. Additionally, the MACD oscillator is coming closer to performing a bullish crossover which could signal that the near-term trend is changing direction. However, whilst these two signals could mitigate some of the selling pressure inspired by the EMA bias and Parabolic SAR, it is unlikely that they can provide the requisite momentum to push the AUDNZD above the 23.6% Fibonacci level.
The key factor intimating that a serious rally could be in the wings is the development of a Three Drive pattern. Whilst its second peak’s retracement is somewhat messy, overall, the pattern follows the textbook price movements fairly faithfully. As a result of this, the pair could be on the cusp of surging higher, likely up to the 78.6% Fibonacci level. Moreover, depending on the fundamental results, the rally could even extend beyond this price and see the falling wedge broken.
Ultimately, we may have to wait until the coming week to see this pair make a decent move as the shift in momentum seems to be taking its time. However, with NZ releasing its GDP results next week, the spark to ignite the rally could be provided if it comes in significantly below expectations. This being said, if the 23.6% Fibonacci level is broken prior to the release of the data, buying pressure could surge strongly so monitor the pair closely in the lead up.
Forex and CFDs are leveraged financial instruments. Trading on such leveraged products carries a high level of risk and may not be suitable for all investors. Please ensure that you read and fully understand the Risk Disclosure Policy before entering any transaction with Blackwell Global Investments Limited.
Recommended Content
Editors’ Picks
EUR/USD holds above 1.0600 as focus shifts to Powell speech

EUR/USD fluctuates in a narrow range above 1.0600 on Tuesday as the better-than-expected Economic Sentiment data from Germany helps the Euro hold its ground. Fed Chairman Powell will speak on the policy outlook later in the day.
GBP/USD stays below 1.2450 after UK employment data

GBP/USD trades marginally lower on the day below 1.2450 in the early European session on Tuesday. The data from the UK showed that the ILO Unemployment Rate in February rose to 4.2% from 4%, weighing on Pound Sterling.
Will Gold reclaim $2,400 ahead of Powell speech?

Gold price consolidates the rebound below $2,400 amid risk-aversion. Dollar gains on strong US Retail Sales data despite easing Middle East tensions. Bullish potential for Gold price still intact on favorable four-hour technical setup.
SOL primed for a breakout as it completes a rounding bottom pattern

Solana price has conformed to the broader market crash, following in the steps of Bitcoin price that remains in the red below the $65,000 threshold. For SOL, however, the sensational altcoin could have a big move in store.
Canada CPI Preview: Inflation expected to accelerate in March, snapping two-month downtrend

The Canadian Consumer Price Index is seen gathering some upside traction in March. The BoC deems risks to the inflation outlook to be balanced. The Canadian Dollar navigates five-month lows against the US Dollar.