![]() Norm Winski
Norm Winski
Independent Analyst
June Review – “ The Stock Market topped near the 4/29 AC Saturn Retrograde and is now in a clear down trend. The initial low was on 5/13 at 2802, giving us a range of 152 S&P points. This is the key harmonic range for the S&P 500. A 1.236 extension, that is 152 x 1.235 = 188 points. Subtracting 188 from 2954 = 2766, which was the low on 5/29, indicating that the S&P is responding to this series. It is likely the S&P is in a stair step decline. The next step down on this Fibonacci ladder is 2744, 1.50 = 2726, and then there may be a substantial low at 2708, which is 1.618 times the 152 harmonic.
If the S&P breaks the 2708 area, that would suggest much lower prices are coming. Astrologically, we have many big planetary events this month. Most noteworthy are two Planetary Polarity Points – 6/20 AC – Neptune in Pisces turns Retrograde and 6/26 AC – Mercury 0 South Latitude. Additionally there are two huge energy cluster dates – 6/14 and 6/27, with near record levels of planetary energy. These dates coincide with 2 of the 3 Fibonacci dates we have for June. Please note how many of the dates below repeat from different sources.”
Results -
Market Math – 6/12 = 116^2 = 13,456 days from the 8/09/1982 major low. 6/12 was a short term low. Score - 1 out of 1 good dates = 100%.
Fibonacci – 6/10, 6/14, 6/27. 6/10 was close in price and one day ahead of a short term high. 6/14 was a very good low. 6/27 was close in price and one day past a short term low. Score - 3 out of 3 good dates = 100%.
7227 NYSE* - 6/14, 6/18 6/14 was a very good low. 6/18 was a breakout of a consolidation which led to the high of the month. Score - 2 out of 2 good dates = 100%.
S&P500* - 6/10, 6/18. 6/10 was close in price and one day ahead of a short term high. 6/18 was a breakout of a consolidation which led to the high of the month. Score - 2 out of 2 good dates = 100%.
US Fed – 6/3, 6/10, 6/17, 6/24, 6/28 AC. 6/3 was the exact low of the month. 6/10 was close in price and one day ahead of a short term high. 6/17 was not effective. 6/24 was close in price and one day past the high of the month. Score – 3 out of 4 good dates = 75%.
Astro – 6/3, 6/10, *6/14*, 6/21, 6/24, *6/27*. 6/3 was the exact low of the month. 6/10 was close in price and one day ahead of a short term high. 6/14 was a very good low. 6/21 was the exact high of the month. 6/24 was close in price and one day past the high of the month. 6/27 was close in price and one day past a good low. Score – 5 out of 5 good dates = 100%. Total Score – 16 out of 17 good dates = 94.12%
Additionally, the June Polarity Adjusted Planetary Index II did a very good job of forecasting the track for the S&P 500 for most of the month. Please see this later in this letter in the Planetary Index results chart section.
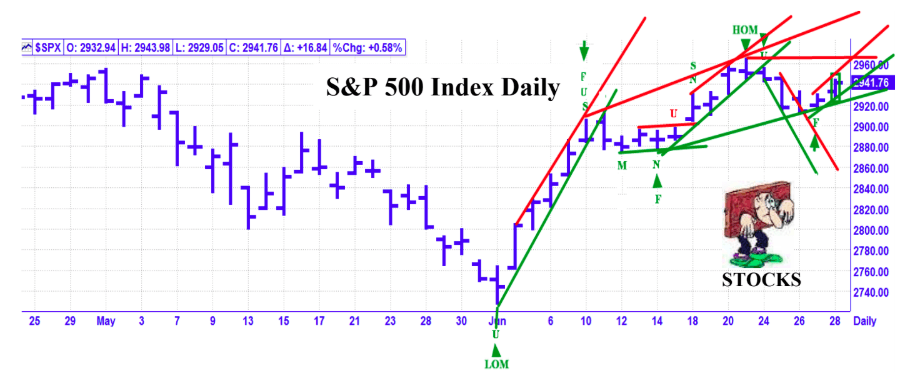
Please note: New rules for the chart markings. If it is Green it is a winner. If it is Red it is a miss. A Green encircled bar at the end of the month, is still open to evaluation due to a lack of time. Astro Date = Arrow. Fibonacci = F. M = Market Math. N = NYSE. D = DJIA. S = S&P. LOM = Low of the Month. HOM = High of the Month. U = US Fed. B = BankEn/US
Fed.
July Update – WOW!!! The first week of July is HUGE. Following are the highlights. 7/01 AC – Geo Mars enters Leo. 7/02 PM – Solar Eclipse. 7/03 AC – Jupiter Contra-Parallel the Moon’s N. Node. 7/03 AC – Venus 0 North Latitude. 7/05 AC – Helio Saturn Parallel Pluto. 7/05 AC – Mercury Perihelion. 7/05 AC Mercury Retrograde.
Let’s take a quick review of some of our top highlights from last month. The 6/3 New Moon was the low of the month. 6/20 AC – Neptune turned Retrograde and that was the high of the month. Then the market pulled back into the 6/26 close which coincided exactly with Mercury at 0 South Latitude and we had a strong rally into the end of the month. Planets turning Direct or Retrograde or reaching 0 Latitude is our top category of planetary events. Guess what’s coming the first week of July? All of the above categories of planetary events. It looks like we could get some big whipsaws during the first week of July and then expect a resolution and trend developing 7/5 – 7/8. A strong rally or decline into the end of the week will probably be reversed by 7/8.
Also noteworthy is that 7/16 AC, there is a Lunar Eclipse. Historically, the Stock Market does not like Lunar Eclipses. Within one trading day, about 75% of the time, the major stock indices have a decline on average of about 1.75 percent.
Technically, the S&P rallied into the 6/28 weekend and is now nearing its all time high at 2964. A substantial break out over this high could pave the way for a run to over 3,000. If that were to happen into 7/5, that could be a set up for a significant top. Stay Tuned!!
Market Math – 7/3 AC – 125^2 days = 15,625 from the 9/22/1976 major high. 7/9 –
Music Math – 11,585 days from the 10/20/87 crash low.
7/19 – 84^2 days = 7056 days from the 3/24/2000 S&P dot.com bubble top.
Fibonacci – 7/8, 7/9, 7/18, 7/19, 7/22
Astro – 7/2, 7/5, 7/8, 7/10, 7/15, 7/16, 7/17, 7/22, 7/25, 7/26 AC
This is an excerpt from the Astro Trend newsletter. Astro-Trend covers about thirty futures related markets including the major Financial Markets, such as the Stock Market, T-Bonds, Currencies, and most major commodities. We also offer intra day data which identifies potential change in trend points to the minute.
Note: All information on this page is subject to change. The use of this website constitutes acceptance of our user agreement. Please read our privacy policy and legal disclaimer. Opinions expressed at FXstreet.com are those of the individual authors and do not necessarily represent the opinion of FXstreet.com or its management. Risk Disclosure: Trading foreign exchange on margin carries a high level of risk, and may not be suitable for all investors. The high degree of leverage can work against you as well as for you. Before deciding to invest in foreign exchange you should carefully consider your investment objectives, level of experience, and risk appetite. The possibility exists that you could sustain a loss of some or all of your initial investment and therefore you should not invest money that you cannot afford to lose. You should be aware of all the risks associated with foreign exchange trading, and seek advice from an independent financial advisor if you have any doubts.
Recommended Content
Editors’ Picks
EUR/USD clings to daily gains above 1.0650

EUR/USD gained traction and turned positive on the day above 1.0650. The improvement seen in risk mood following the earlier flight to safety weighs on the US Dollar ahead of the weekend and helps the pair push higher.
GBP/USD recovers toward 1.2450 after UK Retail Sales data

GBP/USD reversed its direction and advanced to the 1.2450 area after touching a fresh multi-month low below 1.2400 in the Asian session. The positive shift seen in risk mood on easing fears over a deepening Iran-Israel conflict supports the pair.
Gold holds steady at around $2,380 following earlier spike

Gold stabilized near $2,380 after spiking above $2,400 with the immediate reaction to reports of Israel striking Iran. Meanwhile, the pullback seen in the US Treasury bond yields helps XAU/USD hold its ground.
Bitcoin Weekly Forecast: BTC post-halving rally could be partially priced in Premium

Bitcoin price shows no signs of directional bias while it holds above $60,000. The fourth BTC halving is partially priced in, according to Deutsche Bank’s research.
Week ahead – US GDP and BoJ decision on top of next week’s agenda

US GDP, core PCE and PMIs the next tests for the Dollar. Investors await BoJ for guidance about next rate hike. EU and UK PMIs, as well as Australian CPIs also on tap.