![]()
Hello traders! I’m writing this week’s newsletter from beautiful Norwalk, Connecticut, while watching the sunset on Wednesday of a futures class. In this class there is a student who loves to use Bollinger Bands® as his own odds enhancer when trading, so I thought I would share a few helpful tips for this tool, applied to the spot forex market.
First let’s define what Bollinger Bands are. Investopedia defines Bollinger Bands as, “A band plotted two standard deviations away from a simple moving average, developed by famous technical trader John Bollinger.” If you’ve ever seen a bell curve showing a distribution of measurements of something, for example, people’s heights, incomes, home sizes, whatever, most of the data will be stacked in the middle of the bell curve. The further you go from the median/midpoint of the bell curve either above or below, the fewer data points you will get. If the average height of men in America is 5’9”, most men you meet here will be about that height. How many 7’2” men do you meet? One a month? One a year? The point is the further away from the median data point, the less likely it is to find these measurements. In trading, if prices go above or below the Bollinger Bands, those readings of price action are unusual, and prices should revert back to “normal” or inside the bands, if not all the way to the median. In statistics, the two standard deviations above and below the median (in this case, a moving average) should hold about 96% of all the data. Let’s take a look at a chart, which should be easier to understand!
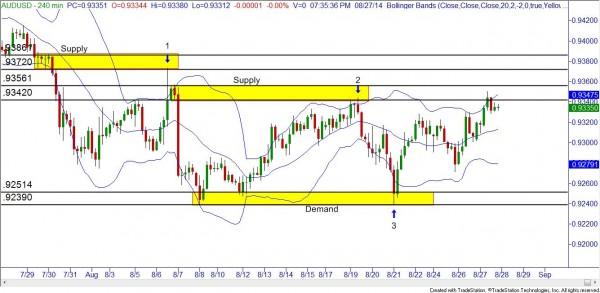
This is a four hour chart of the AUDUSD, with a Bollinger Band overlaid on the price action. The middle blue wiggly line is a 20 period moving average, and the other two wiggly lines are showing two standard deviations above and below the moving average. So, most (~96%) of the price action should be inside of the bands. Whenever price is outside of the bands, especially on fast moves outside of the bands, price action tends to quickly revert back inside the bands, usually to the moving average. If price action moves above the upper wiggly line, prices are considered overbought, and if price action moves below the lower wiggly line, prices are considered oversold.
In addition to the Bollinger Bands on the chart, I have also marked in two of our supply zones and one demand zone. Using the bands as an odds enhancer for your trading can definitely help, otherwise I wouldn’t have written this article! At the blue arrow labeled “1,” you can see that price action rapidly moved up to supply, well past the upper band. So…would you take that short trade? Price moved quickly to a clean supply zone, deep into “overbought” territory on our Bollinger Band tool. I hope you would be interested in this trade! As mentioned previously, a potential first target would be the moving average; however, I prefer to use previous demand for a target on short trades, and previous supply for targets on long trades.
At the second blue arrow, marked “2,” price again moved up into supply, but this time just barely peaked out above the Bollinger Band. While I would prefer a faster, farther move out of the band to take a trade, this example still did fit our criteria.
At the third arrow, marked “3,” price quickly fell into a demand zone and again, well outside the Bollinger Band. This would have fit the criteria of trading with our patented core strategy, plus with the added bonus of being “oversold” with the bands.
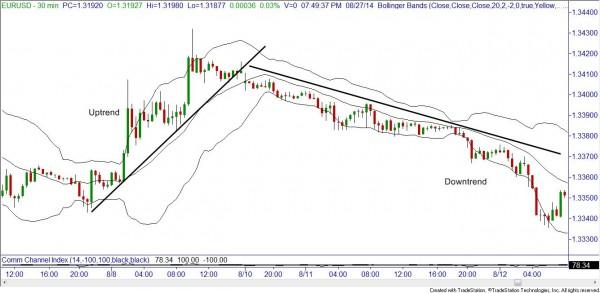
Another helpful use for the Bollinger Band tool is to help you stay with a trending market. In an uptrend, very often the trend will be held between the moving average and the upper band. In a downtrend, usually the move is held between the moving average and the lower band. Both examples are demonstrated in the following chart.
So there you have a breakdown on a couple of easy ways to use the Bollinger Bands to help you trade: first, to help with entering trades, and second, to help you stay with a trending market. Please don’t try to only use Bollinger Bands to make your trading decisions! There have been thousands of traders out there who have tried to use just one indicator or oscillator to make their trading decisions for them; why do you think you don’t hear about those traders? Because using just one thing that comes FREE with your trading platform won’t consistently make you money! Combined with our supply and demand strategy can make these bands a very powerful tool. Yes, there are a few more tricks to these bands, but we’ll have to save those for our live classrooms or our Extended Learning Track online training rooms.
This content is intended to provide educational information only. This information should not be construed as individual or customized legal, tax, financial or investment services. As each individual's situation is unique, a qualified professional should be consulted before making legal, tax, financial and investment decisions. The educational information provided in this article does not comprise any course or a part of any course that may be used as an educational credit for any certification purpose and will not prepare any User to be accredited for any licenses in any industry and will not prepare any User to get a job. Reproduced by permission from OTAcademy.com click here for Terms of Use: https://www.otacademy.com/about/terms
Editors’ Picks
AUD/USD posts gain, yet dive below 0.6500 amid Aussie CPI, ahead of US GDP

The Aussie Dollar finished Wednesday’s session with decent gains of 0.15% against the US Dollar, yet it retreated from weekly highs of 0.6529, which it hit after a hotter-than-expected inflation report. As the Asian session begins, the AUD/USD trades around 0.6495.
USD/JPY finds its highest bids since 1990, approaches 156.00

USD/JPY broke into its highest chart territory since June of 1990 on Wednesday, peaking near 155.40 for the first time in 34 years as the Japanese Yen continues to tumble across the broad FX market.
Gold stays firm amid higher US yields as traders await US GDP data

Gold recovers from recent losses, buoyed by market interest despite a stronger US Dollar and higher US Treasury yields. De-escalation of Middle East tensions contributed to increased market stability, denting the appetite for Gold buying.
Ethereum suffers slight pullback, Hong Kong spot ETH ETFs to begin trading on April 30

Ethereum suffered a brief decline on Wednesday afternoon despite increased accumulation from whales. This follows Ethereum restaking protocol Renzo restaked ETH crashing from its 1:1 peg with ETH and increased activities surrounding spot Ethereum ETFs.
Dow Jones Industrial Average hesitates on Wednesday as markets wait for key US data

The DJIA stumbled on Wednesday, falling from recent highs near 38,550.00 as investors ease off of Tuesday’s risk appetite. The index recovered as US data continues to vex financial markets that remain overwhelmingly focused on rate cuts from the US Fed.
RECOMMENDED LESSONS
Making money in forex is easy if you know how the bankers trade!
Discover how to make money in forex is easy if you know how the bankers trade!
5 Forex News Events You Need To Know
In the fast moving world of currency markets, it is extremely important for new traders to know the list of important forex news...
Top 10 Chart Patterns Every Trader Should Know
Chart patterns are one of the most effective trading tools for a trader. They are pure price-action, and form on the basis of underlying buying and...
7 Ways to Avoid Forex Scams
The forex industry is recently seeing more and more scams. Here are 7 ways to avoid losing your money in such scams: Forex scams are becoming frequent. Michael Greenberg reports on luxurious expenses, including a submarine bought from the money taken from forex traders. Here’s another report of a forex fraud. So, how can we avoid falling in such forex scams?
What Are the 10 Fatal Mistakes Traders Make
Trading is exciting. Trading is hard. Trading is extremely hard. Some say that it takes more than 10,000 hours to master. Others believe that trading is the way to quick riches. They might be both wrong. What is important to know that no matter how experienced you are, mistakes will be part of the trading process.


