My last article was the first in a series on the Option Payoff Graph, or Risk Graph. Today we continue with that.
Our example was a neutral-to-bullish option trade on General Electric stock. We actually began this example in an article on types of options expiration dates a few weeks ago and, so far, GE is still hanging in there.
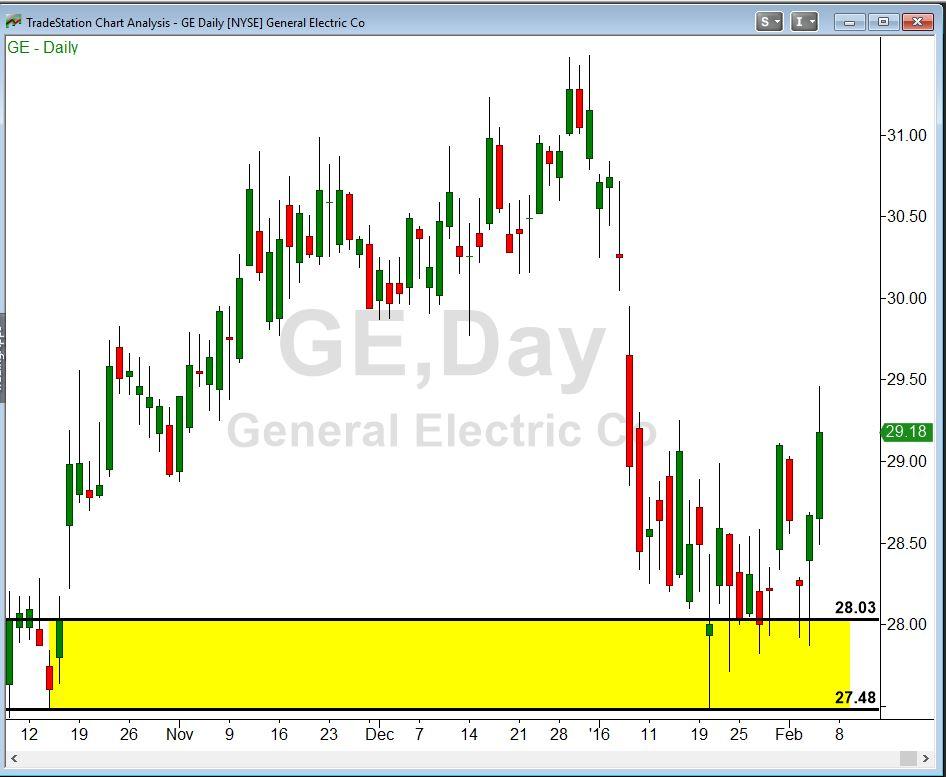
Here is what the GE chart looked like on February 4:
We expected GE to reverse out of the demand zone created last October in the range from $27.48 to $28.03. A week ago, we could have sold the GE February puts at the $27 strike price for $.39 per share, or $39 per contract.
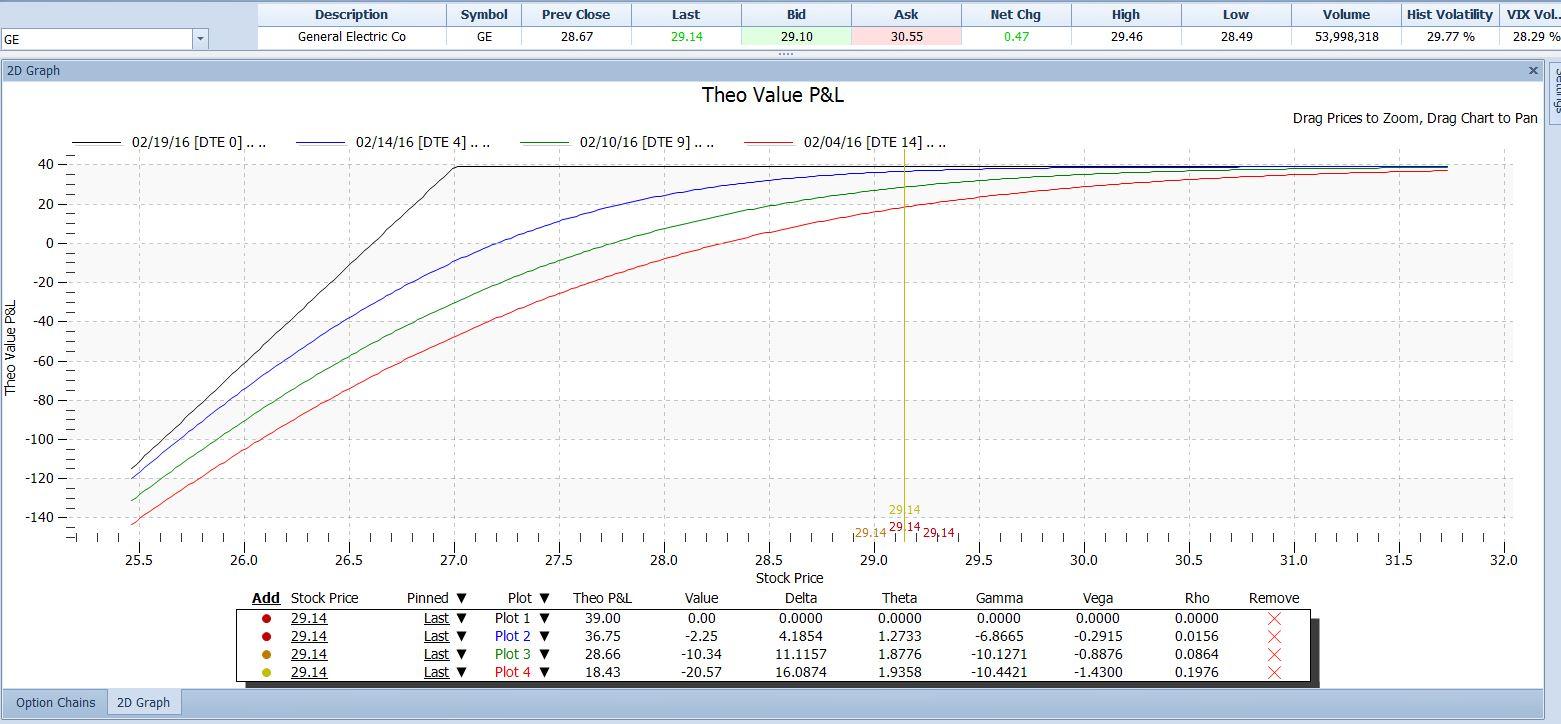
In last week’s article, we showed the option payoff graph for that option trade. Here we update that to show it as of now, with some additions:
Last week we only showed the one gray line, which represents the profit or loss on this trade at the displayed stock prices if we held that position until the puts expired.
Today we’ve added three more lines (the blue, green and red ones) which show the profit or loss at different dates in the future. The red one is as of today, February 4, at which time there were 14 days to expiration. The green line is as of February 10, when there will be nine days to go. And, the blue line is as of February 14, when there will be just four days to go.
The straight gray lines, as stated above, represent the profit at any stock price on the expiration date. At that time, the option will have a value exactly equal to its intrinsic value – the amount by which the stock has fallen below the $27 strike price, if any. If the stock is not below $27 at that time, the position will be worthless. That is what we want since we have sold the option short. We would then not have to pay anything to extract ourselves from the option trade, and we would keep the $39 we received for selling the put. That is why the gray line is horizontal at a height of $39 at all stock prices at or above $27. It slopes downward to the left at stock prices below $27, which reflects the fact that if the stock is lower than $27, the puts will have value and we would have to pay that value. That reduces our profit.
The red, green and blue lines show how the profit picture changes from day to day. At the time this graph was drawn, GE stock was at $29.14. If we were to close out the position right now, we would have to pay $.205 per share for the puts, or $20.50 for the contract. The option still has that $20 value because in the remaining 14 days of its life GE could still drop below $27.
With every passing day that gets less likely; and so the value of the option declines. At four days to go (the blue line), if the stock were still at $29.14 there would be virtually no chance that it could drop as low as $27, so the value of the put would be next to zero. The blue line indicates that the option would be worth just $.0225 per share at that point, giving us almost all of our profit.
The table at the bottom of the graph allows us to specify different stock prices and/or different future dates so we can evaluate how our position’s profit will evolve.
The graph and its P/L estimates are an essential part of an option trader’s toolkit. Take the time to learn how yours works and it will pay you back many times over.
This content is intended to provide educational information only. This information should not be construed as individual or customized legal, tax, financial or investment services. As each individual's situation is unique, a qualified professional should be consulted before making legal, tax, financial and investment decisions. The educational information provided in this article does not comprise any course or a part of any course that may be used as an educational credit for any certification purpose and will not prepare any User to be accredited for any licenses in any industry and will not prepare any User to get a job. Reproduced by permission from OTAcademy.com click here for Terms of Use: https://www.otacademy.com/about/terms
Editors’ Picks
AUD/USD hovers around 0.6500 amid light trading, ahead of US GDP

AUD/USD is trading close to 0.6500 in Asian trading on Thursday, lacking a clear directional impetus amid an Anzac Day holiday in Australia. Meanwhile, traders stay cautious due ti risk-aversion and ahead of the key US Q1 GDP release.
USD/JPY finds its highest bids since 1990, near 155.50

USD/JPY keeps breaking into its highest chart territory since June of 1990 early Thursday, testing 155.50 for the first time in 34 years as the Japanese Yen remains vulnerable, despite looming Japanese intervention risks. Focus shifts to Thursday's US GDP report and the BoJ decision on Friday.
Gold price treads water near $2,320, awaits US GDP data

Gold price recovers losses but keeps its range near $2,320 early Thursday. Renewed weakness in the US Dollar and the US Treasury yields allow Gold buyers to breathe a sigh of relief. Gold price stays vulnerable amid Middle East de-escalation, awaiting US Q1 GDP data.
Injective price weakness persists despite over 5.9 million INJ tokens burned

Injective price is trading with a bearish bias, stuck in the lower section of the market range. The bearish outlook abounds despite the network's deflationary efforts to pump the price. Coupled with broader market gloom, INJ token’s doomed days may not be over yet.
Meta Platforms Earnings: META sinks 10% on lower Q2 revenue guidance Premium

This must be "opposites" week. While Doppelganger Tesla rode horrible misses on Tuesday to a double-digit rally, Meta Platforms produced impressive beats above Wall Street consensus after the close on Wednesday, only to watch the share price collapse by nearly 10%.
RECOMMENDED LESSONS
Making money in forex is easy if you know how the bankers trade!
Discover how to make money in forex is easy if you know how the bankers trade!
5 Forex News Events You Need To Know
In the fast moving world of currency markets, it is extremely important for new traders to know the list of important forex news...
Top 10 Chart Patterns Every Trader Should Know
Chart patterns are one of the most effective trading tools for a trader. They are pure price-action, and form on the basis of underlying buying and...
7 Ways to Avoid Forex Scams
The forex industry is recently seeing more and more scams. Here are 7 ways to avoid losing your money in such scams: Forex scams are becoming frequent. Michael Greenberg reports on luxurious expenses, including a submarine bought from the money taken from forex traders. Here’s another report of a forex fraud. So, how can we avoid falling in such forex scams?
What Are the 10 Fatal Mistakes Traders Make
Trading is exciting. Trading is hard. Trading is extremely hard. Some say that it takes more than 10,000 hours to master. Others believe that trading is the way to quick riches. They might be both wrong. What is important to know that no matter how experienced you are, mistakes will be part of the trading process.


