Last week I wrote that an option trading opportunity consists of three elements:
What do I think the stock price is most likely to do?
What do I think the Implied Volatility of its options is most likely to do?
How aggressive do I want to be?
Today we’ll look at an example.
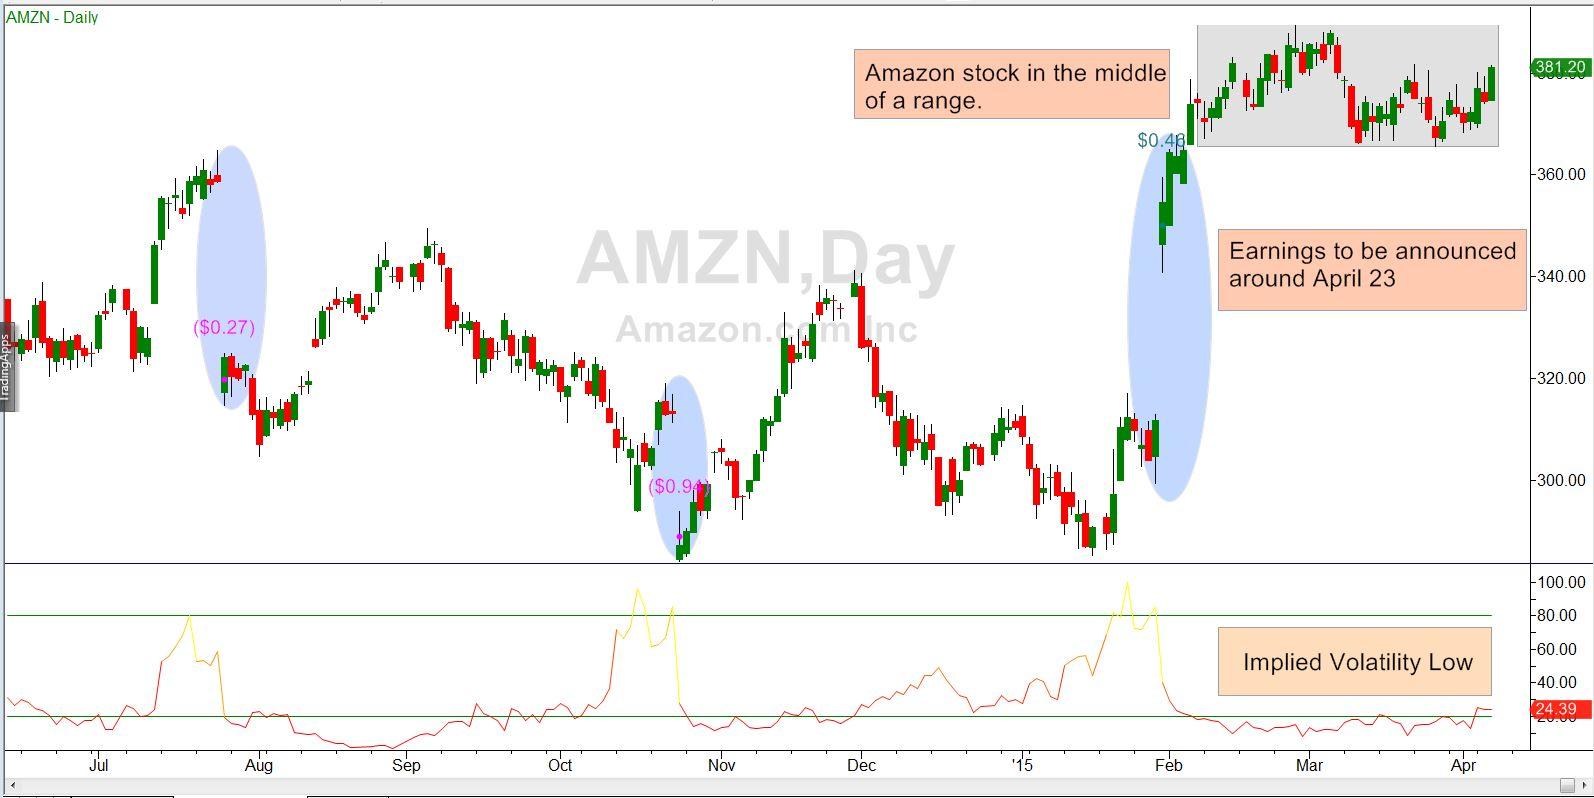
On April 8, Amazon’s price chart looked like this:
The stock, at $381, was about in the middle of a range in which it had been moving for the last three months.
Implied volatility (a measure of how inflated its options were) was at a very low level, around its 25th percentile, as shown by the Implied Volatility Stochastic indicator at the bottom of the chart.
Note, on that indicator the regular peaks at three-month intervals. These correspond to earnings announcement dates. In the weeks preceding the earnings announcements Amazon’s options tend to inflate dramatically as traders anticipate that the announcements will have a big impact on the stock price.
This anticipation is not without reason. Notice the blue ellipses on the chart around the end of August, November and January. These show large price gaps that happened when the announcements were made. This pattern of large price gaps on earnings dates has been commonplace for this stock for years.
How could we take advantage of the current situation?
Let’s look at our Big Three questions one at a time.
1. What do we think the stock price is most likely to do?
In this case it was likely to move a large amount when earnings were released. In many cases in the past, this is what has happened. It is very common for AMZN to move ten percent or more in a single day.
Unfortunately, the direction of that move is impossible to tell. I learned over many years being a controller of public corporations that even if you know exactly what the earnings number is going to be, you can never predict the market’s reaction to it. A stock can tank on great earnings if they weren’t great enough compared to expectations. Or it can fly on dud earnings if they were just less terrible than expected.
There are ways to bet on a large move of unknown direction. One of those is with a Straddle. In that strategy we buy both a call option and a put option at the same strike price, usually the one nearest the current price. If the stock moves by a large enough amount in either direction, one of those options could make enough money to pay for both plus a profit. But it has to be a very large move.
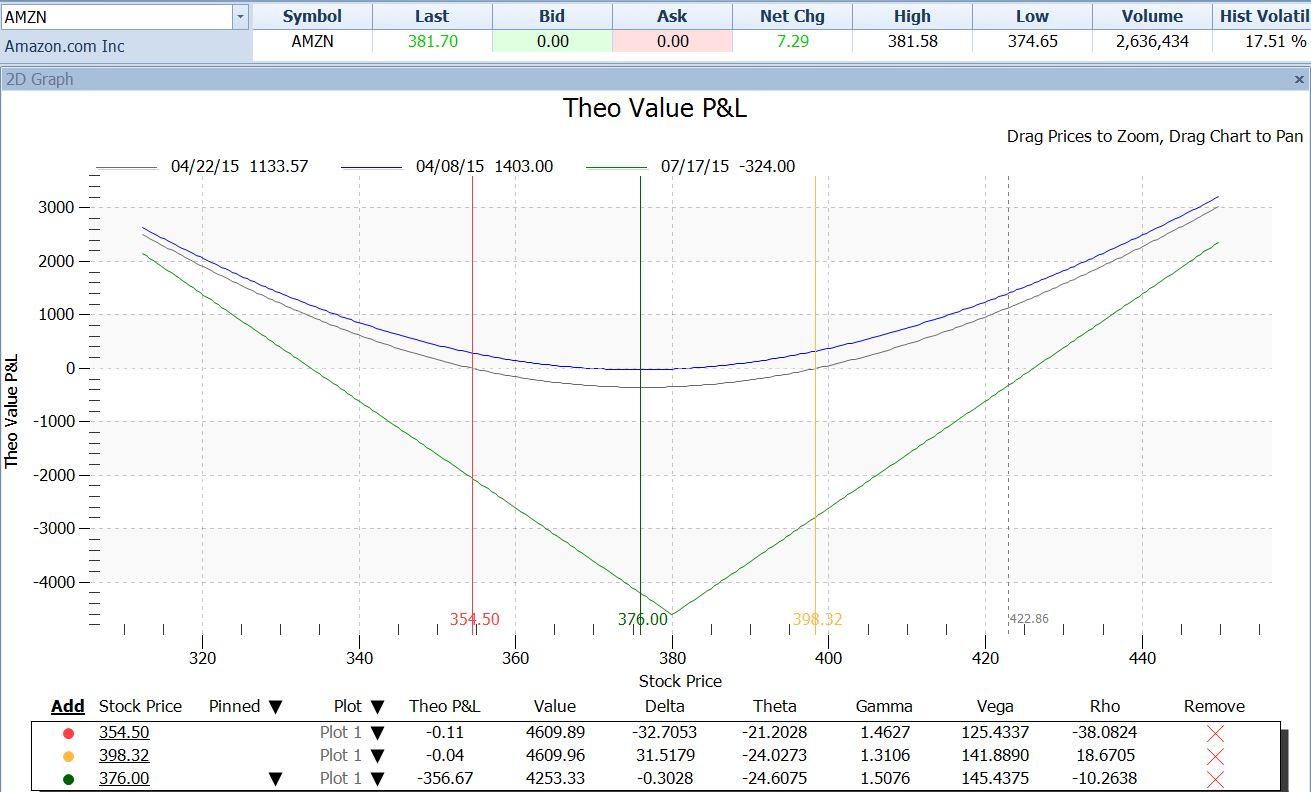
Below is a payoff graph for a straddle on AMZN at the $380 strike:
We chose the July $380 options here, which would still have three months to run after the earnings announcement on April 23. The calls could have been bought at $23.65 and the puts at $22.15, for a total of $45.80 per share, or $4,580 per contract.
The green straight lines plot the profit or loss on the straddle position as a whole at any stock price as of the expiration date of July 17. These green lines are not relevant to us – we have no intention of holding the position that long. We need to know what the profit or loss would be at different stock prices right before the announcement date, on April 22.
That is shown by the gray curved line which shows the projected profit or loss as of April 22 for any price of AMZN – assuming no change in implied volatility (the blue line shows the position’s profit or loss as of the entry date at any AMZN price).
In the table below the chart are selected AMZN prices which correspond to the vertical lines on the chart. I selected the price levels at which this trade would break even on April 22, if implied volatility remained constant. These prices were $354.50 on the downside (7.2% below current price) and $398.32 on the upside (4.36% above current price). If our plan was to close this trade before the announcement, and if implied volatility failed to budge, AMZN would have to go beyond one of those prices before the announcement for the trade to make money. Not impossible, but not too likely.
I also located the price at which this trade would have the largest loss on April 22. That turned out to be with AMZN at $376, at which price the trade would lose about $357.00 (for the contract, not per share). This amount was 7.8% of the $4,580 capital at risk. Bear in mind, all of this is assuming implied volatility did not change between now and April 22.
But that leads to the next question:
2. What do I think the Implied Volatility is most likely to do?
AMZN’s implied volatility was extremely likely to rise for the next two weeks in the run-up to earnings. Then, immediately after the announcement, it would most likely collapse back to a low level again.
If implied volatility were to rise this time, just to the lowest pre-earnings volatility level of the last year, that would represent an increase of implied from here of over 68%.
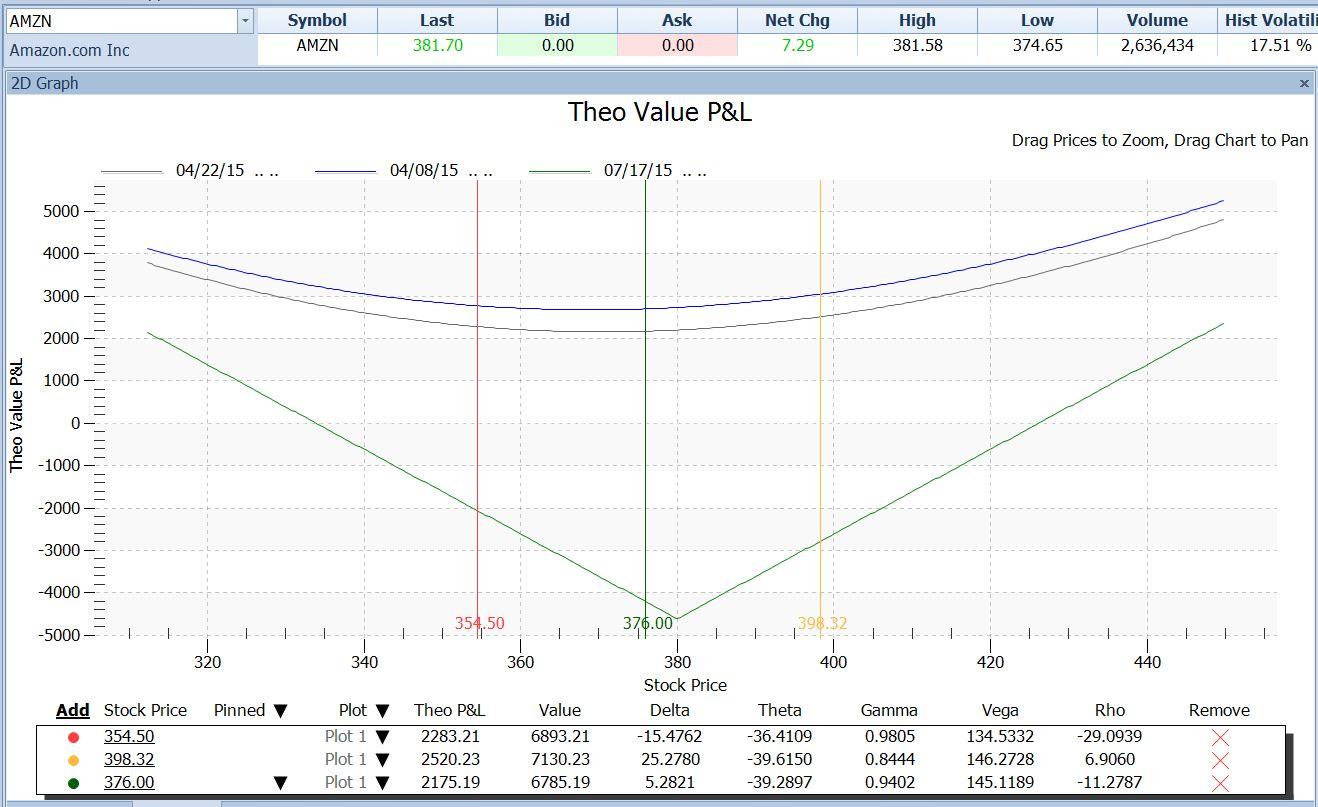
Cranking in a 60% increase in implied volatility, the P/L graph changes to look like this:
Notice that if that increase in implied volatility were to happen before April 22, the entire gray P/L curve would move above the zero P/L line – in other words, the trade would then be profitable at any price of AMZN. The further away from the $380 strike the actual price was, the more profitable it would be.
A possible plan here would have been to buy more than one straddle, if we could afford it; and to sell some or all of them just before the announcement, regardless of where AMZN’s price was then. If the expected IV increase had happened, this would be profitable. If not, the loss would be quite small, probably less than $357 out of each $4580 risked, as described above.
If the stock had moved a great deal at that point, our profit would be greater; and if IV had increased a lot it would also be greater. If that were to be the case, we might want to sell enough of our positions to pay us back for the whole lot plus a profit, and keep one or more as a lottery ticket.
Why do I call it a lottery ticket? Because once the announcement is out implied volatility will definitely and instantly drop back down to a more “normal” level. This will decrease the value of all calls and all puts and will happen overnight when no orderly exit is possible. When the stock opens the next morning the remaining straddles will only be profitable if the stock has in fact moved a very, very large amount away from where it closed the previous day. Otherwise, the drop in value due to the decrease in implied volatility will swamp the effect of stock price movement.
This last point is where our third question comes in:
3. How aggressive do I want to be?
If we decide to take this trade to begin with, the more aggressive way to go is to hold the lottery ticket, but we must realize that it is just that – something that has a small chance of a big payout and a large chance of a loss. The less aggressive stance would be to reap the benefits of the IV increase, if it happens, by selling the entire position before the announcement.
Straddles are fascinating and they sometimes pay off nicely. It is also true that they are more risky than they appear and must be chosen very carefully.
This content is intended to provide educational information only. This information should not be construed as individual or customized legal, tax, financial or investment services. As each individual's situation is unique, a qualified professional should be consulted before making legal, tax, financial and investment decisions. The educational information provided in this article does not comprise any course or a part of any course that may be used as an educational credit for any certification purpose and will not prepare any User to be accredited for any licenses in any industry and will not prepare any User to get a job. Reproduced by permission from OTAcademy.com click here for Terms of Use: https://www.otacademy.com/about/terms
Editors’ Picks
EUR/USD holds above 1.0650 after US data

EUR/USD retreats from session highs but manages to hold above 1.0650 in the early American session. Upbeat macroeconomic data releases from the US helps the US Dollar find a foothold and limits the pair's upside.
GBP/USD retreats toward 1.2450 on modest USD rebound

GBP/USD edges lower in the second half of the day and trades at around 1.2450. Better-than-expected Jobless Claims and Philadelphia Fed Manufacturing Index data from the US provides a support to the USD and forces the pair to stay on the back foot.
Gold clings to strong daily gains above $2,380

Gold trades in positive territory above $2,380 on Thursday. Although the benchmark 10-year US Treasury bond yield holds steady following upbeat US data, XAU/USD continues to stretch higher on growing fears over a deepening conflict in the Middle East.
Ripple faces significant correction as former SEC litigator says lawsuit could make it to Supreme Court

Ripple (XRP) price hovers below the key $0.50 level on Thursday after failing at another attempt to break and close above the resistance for the fourth day in a row.
Have we seen the extent of the Fed rate repricing?

Markets have been mostly consolidating recent moves into Thursday. We’ve seen some profit taking on Dollar longs and renewed demand for US equities into the dip. Whether or not this holds up is a completely different story.
RECOMMENDED LESSONS
Making money in forex is easy if you know how the bankers trade!
Discover how to make money in forex is easy if you know how the bankers trade!
5 Forex News Events You Need To Know
In the fast moving world of currency markets, it is extremely important for new traders to know the list of important forex news...
Top 10 Chart Patterns Every Trader Should Know
Chart patterns are one of the most effective trading tools for a trader. They are pure price-action, and form on the basis of underlying buying and...
7 Ways to Avoid Forex Scams
The forex industry is recently seeing more and more scams. Here are 7 ways to avoid losing your money in such scams: Forex scams are becoming frequent. Michael Greenberg reports on luxurious expenses, including a submarine bought from the money taken from forex traders. Here’s another report of a forex fraud. So, how can we avoid falling in such forex scams?
What Are the 10 Fatal Mistakes Traders Make
Trading is exciting. Trading is hard. Trading is extremely hard. Some say that it takes more than 10,000 hours to master. Others believe that trading is the way to quick riches. They might be both wrong. What is important to know that no matter how experienced you are, mistakes will be part of the trading process.


