This is the sixth and last in a series of articles about option payoff diagrams. The previous articles were part 1, part 2, part 3, part 4 and part 5.
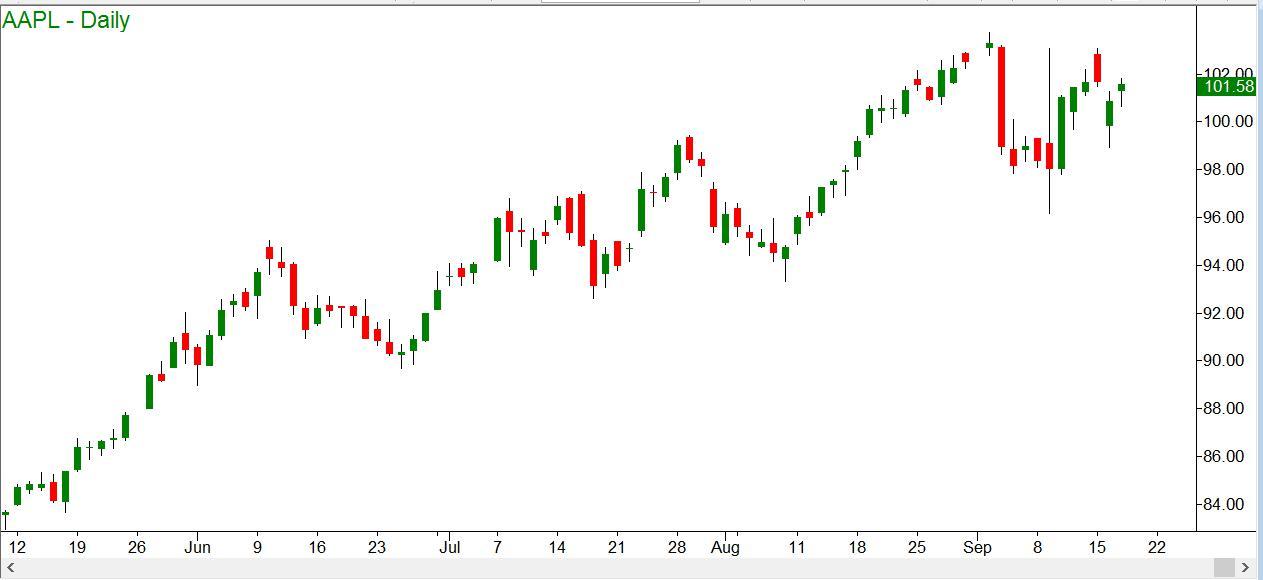
In last week’s installment, we looked at an example of a Vertical Call Spread on Apple stock. Here is the price chart as it appeared then:
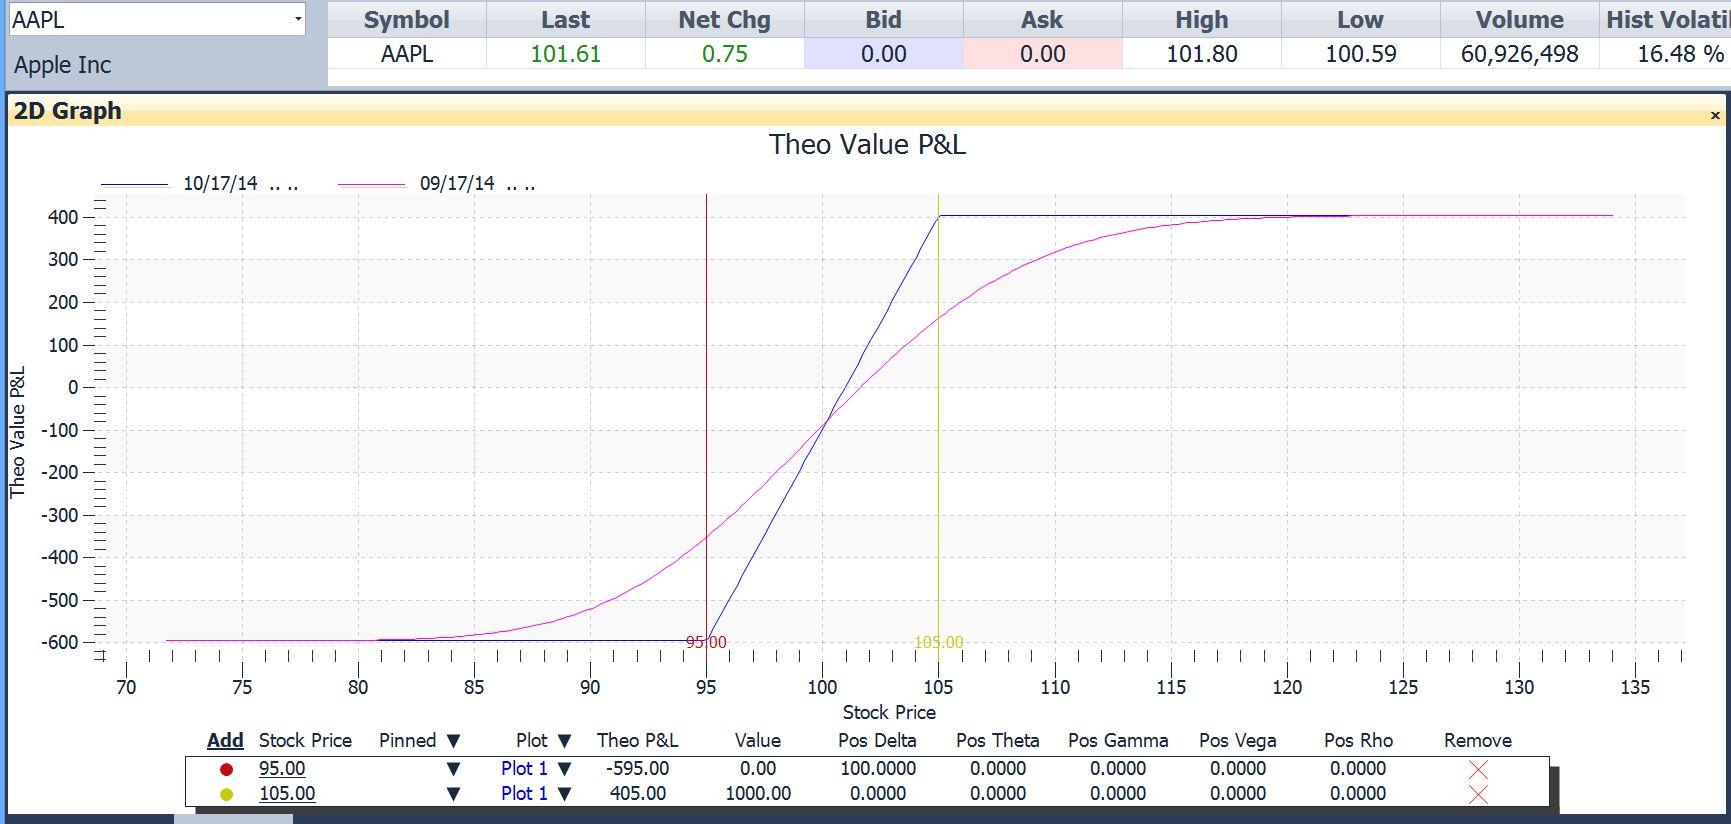
Assuming a bullish outlook, we could at that time have put on a Bull Call Spread, which is one of the variations of the vertical spread. At that time the October 95/105 call spread could be done as follows: Long 1 October 95 calls at $7.20 and short one October 105 calls at $1.25. The net debit was $595 per contract. Here is the diagram as it looked then:
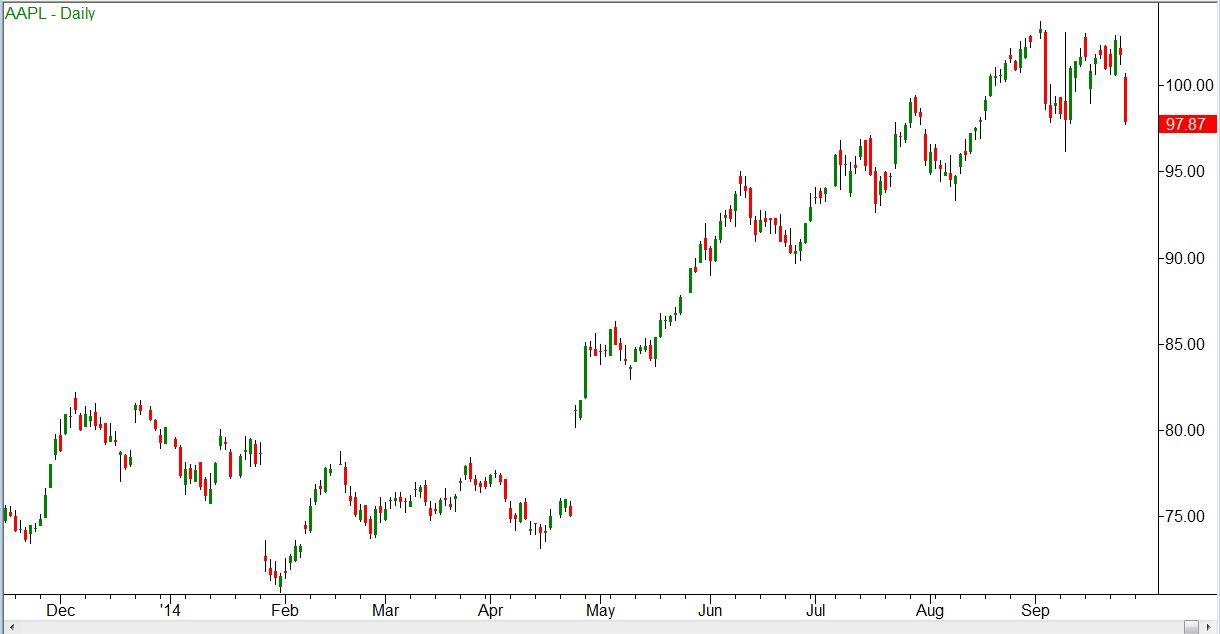
A week later, Apple had dropped a bit, from $101.61 to $97.87 by the close. In after-hours trading it had recovered a bit, to $98.27.
The price chart now looked like so:
The stock had dropped, and was not too far from a previous low at $96.23. Assuming that we were still bullish (which is getting to be a harder assumption to make), we would want to place a stop around that $96.20 level.
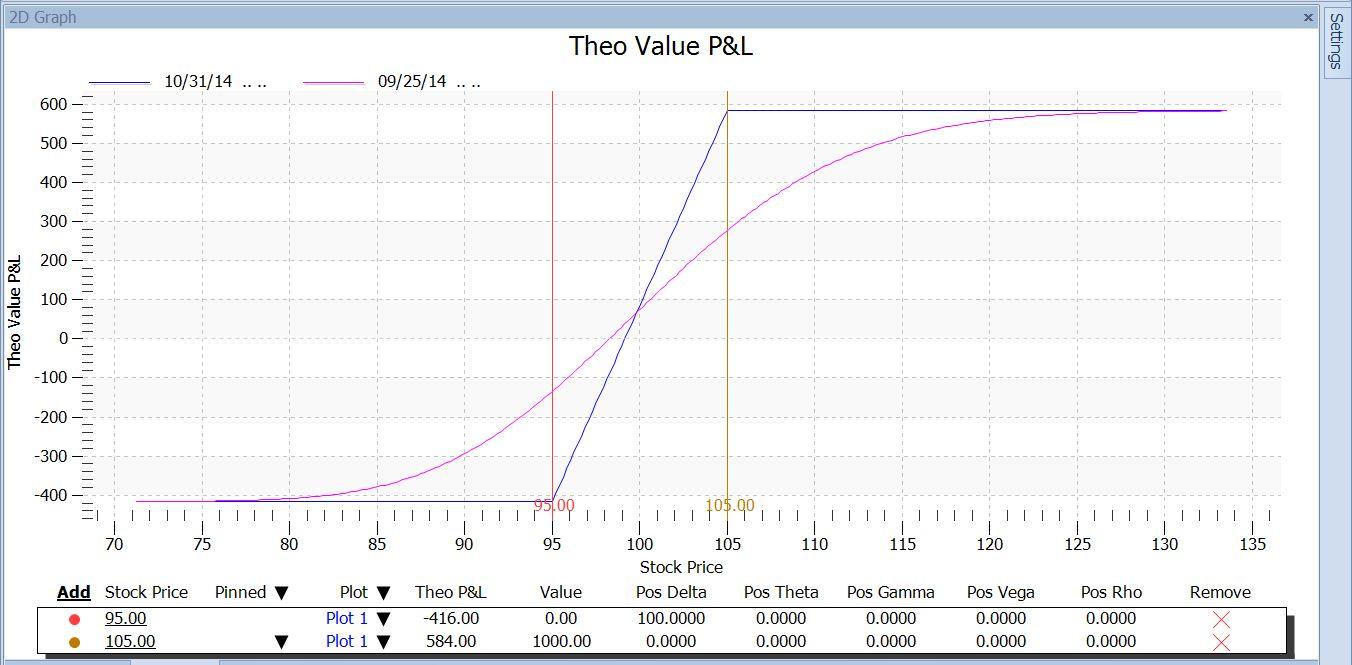
A diagram of the 95/105 bull call spread now appeared like this:
Using the payoff diagram, we can answer some what-if questions, like these:
- If Apple drops to my stop level at $96.20 – How much would I lose if it happened today? What if it didn’t happen until expiration?
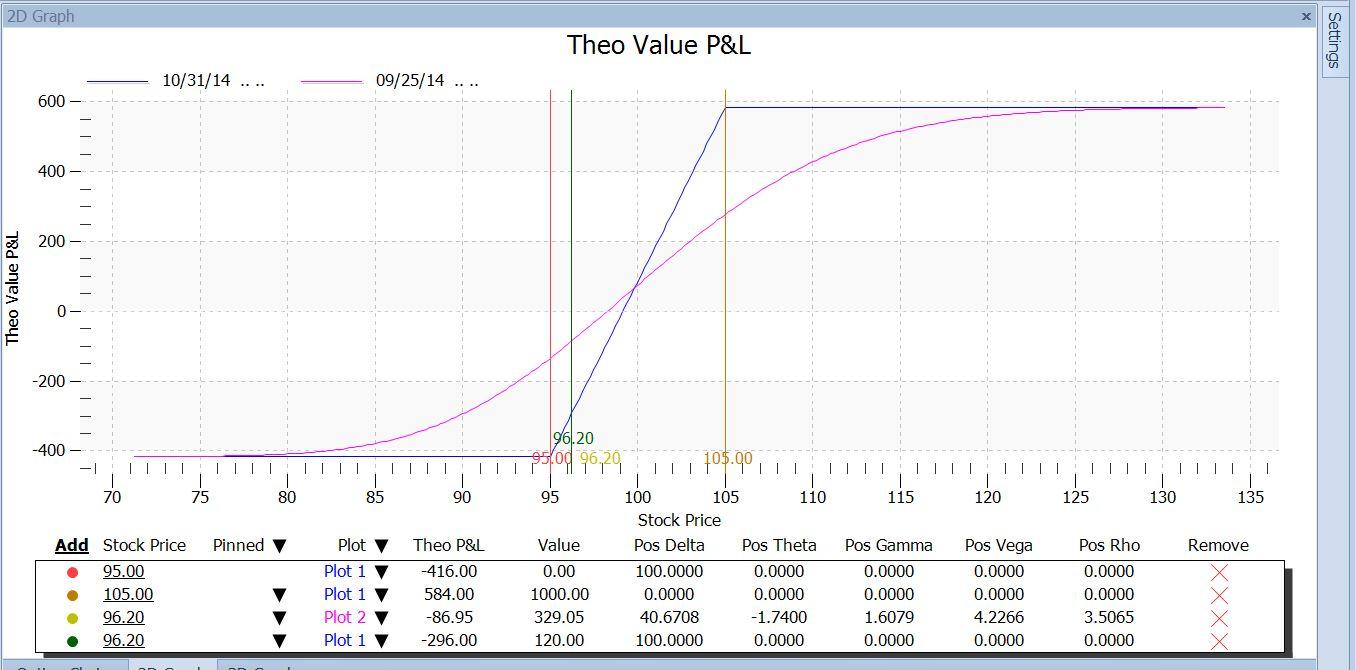
This is easy to answer by placing a marker at that $96.20 price, as in this version:
From the table under the chart, we can see that if that happened today, we would have a loss of $86.95 (next to last row, Theo P&L column). If the trade tortured us by waiting until the last minute to hit that stop, our loss would be $296.00 (last row). The difference is the net time value that we own today.
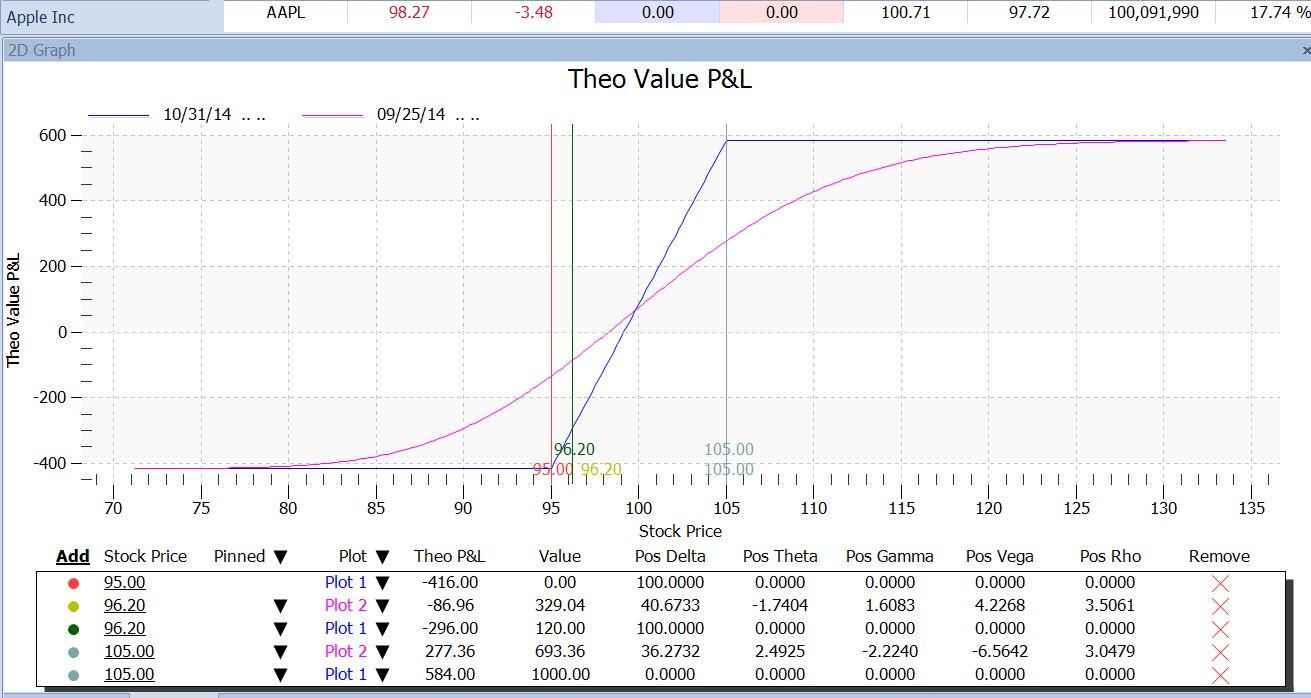
In the same way we can see what the effect would be of Apple reaching the $105 target, by placing a marker there:
Now we can see that at the $105.00 target, this trade would make $277.36 if it happened today; and if it took until expiration, it would make $584.00, which is twice as much. Also, following that magenta line upward, we can see that it doesn’t hit the maximum P/L mark today unless Apple goes to $125.
This might be kind of curious until we think about it. Why is it a good thing that the trade ends soon if it goes against us, but better if it takes longer if it goes our way?
The answer here can be seen from the fact that the current P/L line (magenta) is above the expiration P/L line (blue) at stock prices below $100. In that range, the $95 long call has more time value than the $105 short call, so we are net long time value. But at stock prices higher than $100, the opposite is true. When the stock price leaves the $95 strike behind and rises toward the $105 strike, the $95 call goes further and further into the money. It gains intrinsic value, but actually loses time value. Meanwhile, the $105 call transitions from being very far out of the money to being close to the money. So it gains time value. At some point the $105 short call has more time value than the $95 long call. At that point, we become net short time value. From that price upwards, the passage of time no longer hurts us, and instead it helps us.
Furthermore, at prices that are high enough ($125), the blue and magenta lines merge. That tells us that if that price were reached today, the $105 call itself would be so far in the money that it would no longer have any time value either. At that point, there would be no time value in either option, and each would be worth just its intrinsic value. The intrinsic value of our long $95 call would be stock price – strike price = $125 – $95 = $30. That of the short $105 call would be would be $125 – 105 = $20. So the net value would be $30 – $20, or $10 per share.
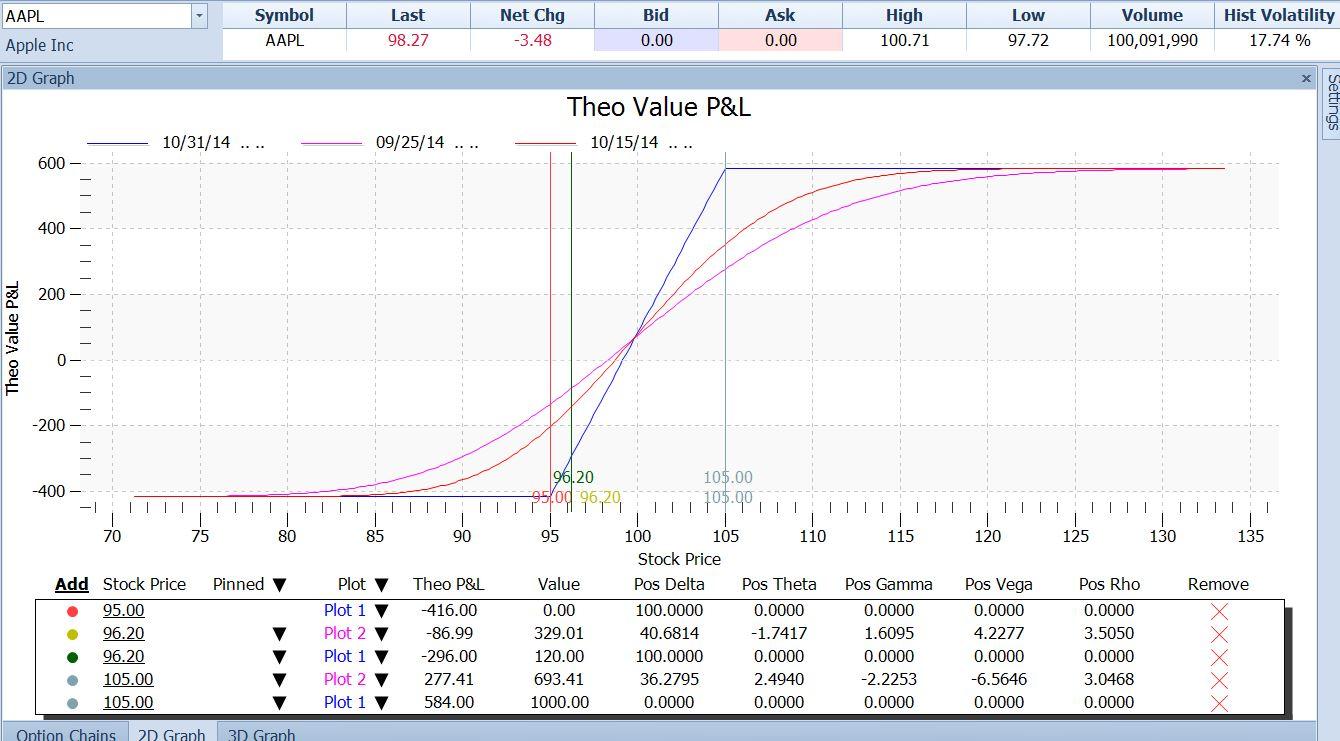
As each day goes by, the magenta “current P/L” line moves toward the blue “expiration P/L” line. If we want to see the effect of that at some intermediate time, we can add another plot, which is as of a different time – say 2 weeks away. Here is what that looks like:
The red line now shows that the farther out in time we are, the nearer the price at which we make our maximum profit.
I hope this series has stimulated you to look into the uses of the option payoff diagrams for your option trading. The more you use them, the more invaluable you will find them.
This content is intended to provide educational information only. This information should not be construed as individual or customized legal, tax, financial or investment services. As each individual's situation is unique, a qualified professional should be consulted before making legal, tax, financial and investment decisions. The educational information provided in this article does not comprise any course or a part of any course that may be used as an educational credit for any certification purpose and will not prepare any User to be accredited for any licenses in any industry and will not prepare any User to get a job. Reproduced by permission from OTAcademy.com click here for Terms of Use: https://www.otacademy.com/about/terms
Editors’ Picks
AUD/USD stands firm above 0.6500 with markets bracing for Aussie PPI, US inflation

The Aussie Dollar begins Friday’s Asian session on the right foot against the Greenback after posting gains of 0.33% on Thursday. The AUD/USD advance was sponsored by a United States report showing the economy is growing below estimates while inflation picked up. The pair traded at 0.6518.
EUR/USD mired near 1.0730 after choppy Thursday market session

EUR/USD whipsawed somewhat on Thursday, and the pair is heading into Friday's early session near 1.0730 after a back-and-forth session and complicated US data that vexed rate cut hopes.
Gold soars as US economic woes and inflation fears grip investors

Gold prices advanced modestly during Thursday’s North American session, gaining more than 0.5% following the release of crucial economic data from the United States. GDP figures for the first quarter of 2024 missed estimates, increasing speculation that the US Fed could lower borrowing costs.
Bitcoin price continues to get rejected from $65K resistance as SEC delays decision on spot BTC ETF options

Bitcoin (BTC) price has markets in disarray, provoking a broader market crash as it slumped to the $62,000 range on Thursday. Meanwhile, reverberations from spot BTC exchange-traded funds (ETFs) continue to influence the market.
US economy: Slower growth with stronger inflation

The dollar strengthened, and stocks fell after statistical data from the US. The focus was on the preliminary estimate of GDP for the first quarter. Annualised quarterly growth came in at just 1.6%, down from the 2.5% and 3.4% previously forecast.
RECOMMENDED LESSONS
Making money in forex is easy if you know how the bankers trade!
Discover how to make money in forex is easy if you know how the bankers trade!
5 Forex News Events You Need To Know
In the fast moving world of currency markets, it is extremely important for new traders to know the list of important forex news...
Top 10 Chart Patterns Every Trader Should Know
Chart patterns are one of the most effective trading tools for a trader. They are pure price-action, and form on the basis of underlying buying and...
7 Ways to Avoid Forex Scams
The forex industry is recently seeing more and more scams. Here are 7 ways to avoid losing your money in such scams: Forex scams are becoming frequent. Michael Greenberg reports on luxurious expenses, including a submarine bought from the money taken from forex traders. Here’s another report of a forex fraud. So, how can we avoid falling in such forex scams?
What Are the 10 Fatal Mistakes Traders Make
Trading is exciting. Trading is hard. Trading is extremely hard. Some say that it takes more than 10,000 hours to master. Others believe that trading is the way to quick riches. They might be both wrong. What is important to know that no matter how experienced you are, mistakes will be part of the trading process.
