My recent articles have been about using the option payoff diagram as an analysis tool. In the first four installments (part 1, part 2, part 3 and part 4) we looked at an example of a covered call position on Apple stock. Today we’ll move on to a different kind of position whose payoff chart has some different characteristics.
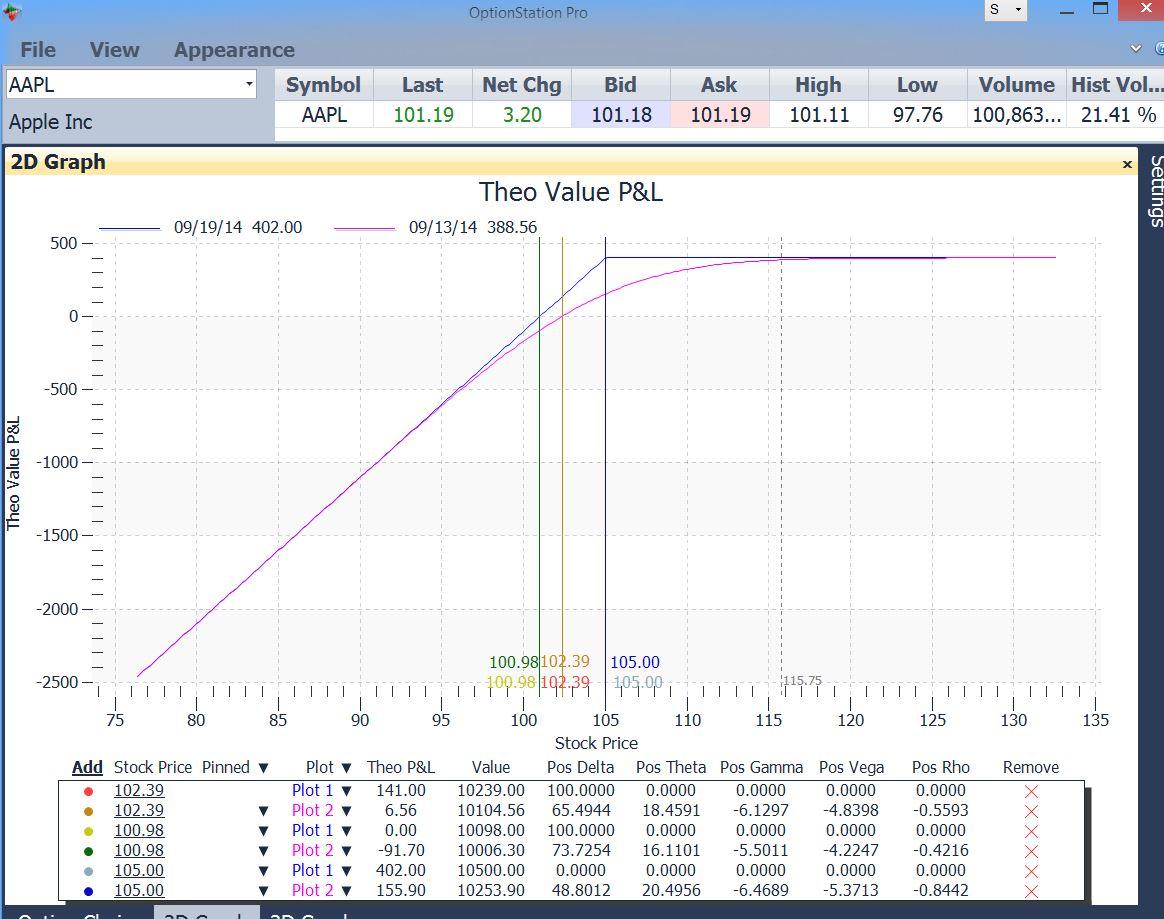
For comparison, here’s the last diagram from last week:
Figure 1 – Covered call position. Long 100 shares AAPL at $102.39, short 1 Sep 105 call at $1.41.
This covered call was a bullish position, with a maximum profit of $402. This maximum profit would occur if AAPL were to be at any price above the $105 strike at the September expiration. If Apple were to remain unchanged at its present price of $101.58 until then, the covered call would make $.60 per share, as follows:
Apple purchase price $102.39
Ending Apple price 101.58
Loss on Apple stock ($ .81)
Gain on Apple 105 call (original sale price) 1.41
Net Gain (per share) $ .60
By selling the 105 call for $1.41, we lowered out break-even price by that amount. So even though the price of our stock went down, the trade still showed a profit overall.
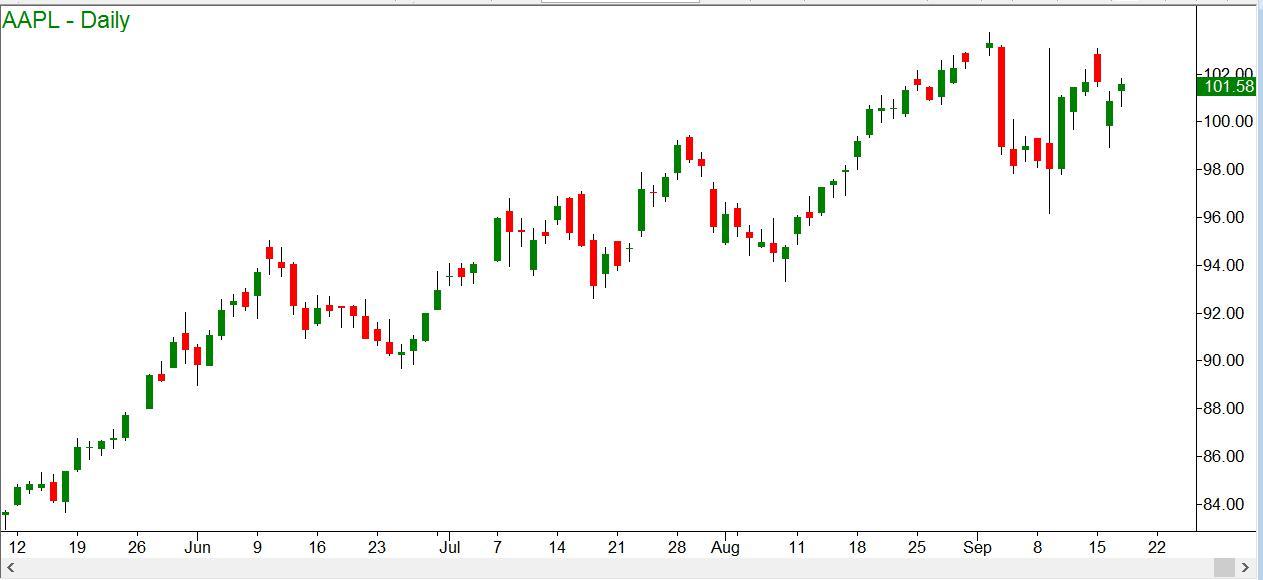
Okay, so much for the covered call. Here is Apple’s price chart as it looked after the close on September 17:
Figure 2 – Apple daily chart
Since we started with a bullish trade, let’s assume that we are still bullish, for which a case can be made. There are plenty of bullish option strategies to pick from. One of those a vertical call spread. This has some similarity to the covered call: It makes money if the stock goes up, and loses if it goes down more than a little. But there are also differences. The payoff diagram helps highlight both the similarities and the differences. Let’s check it out.
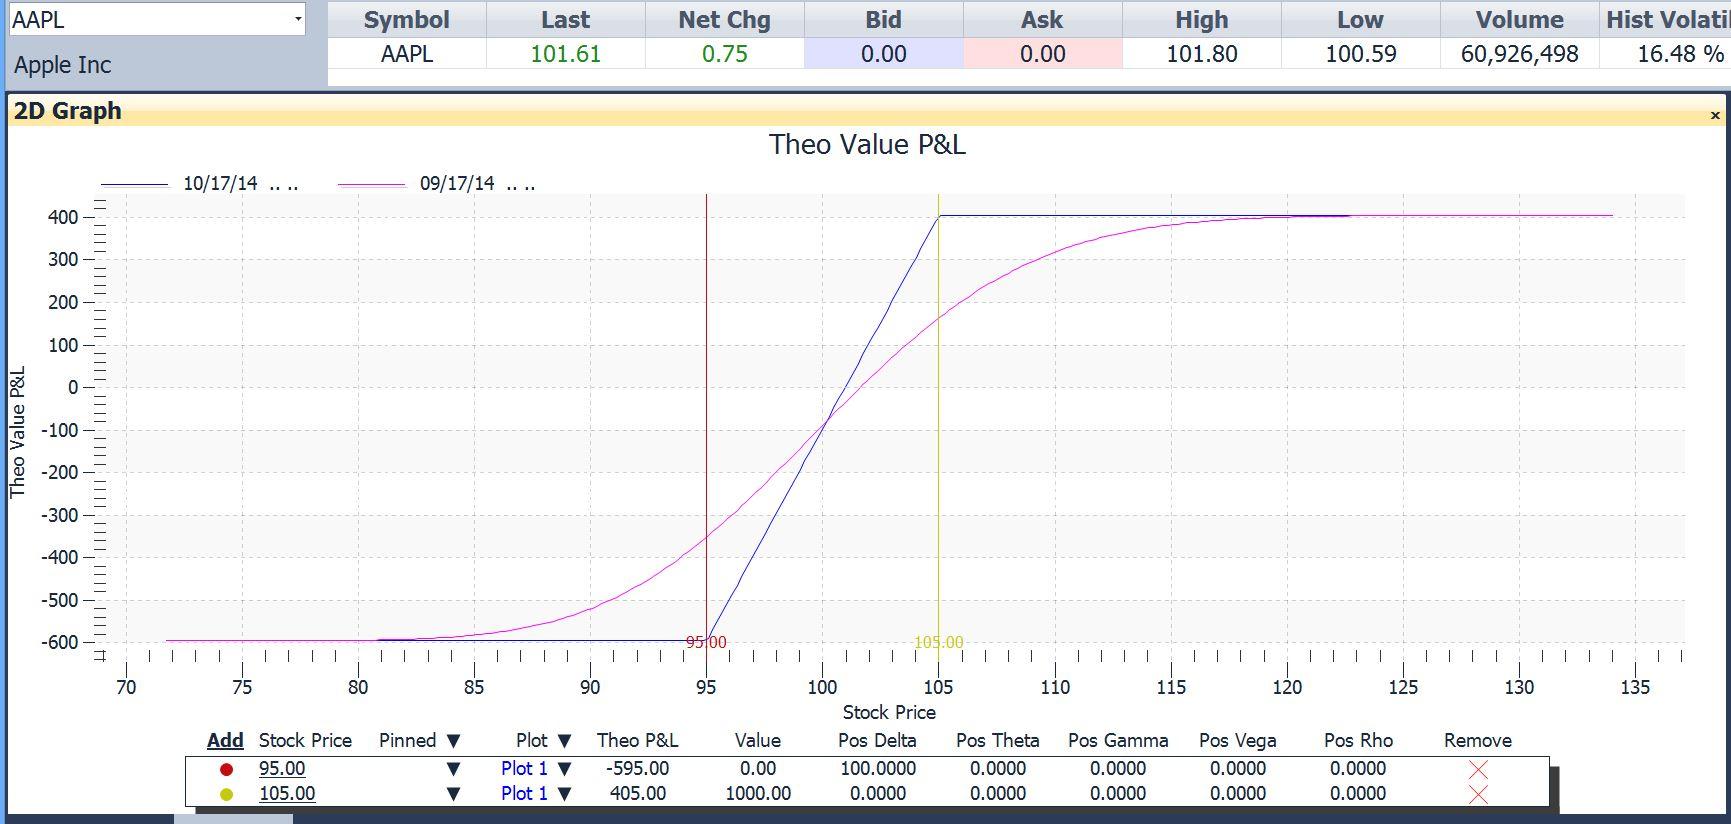
Since at this point the September options were just about to expire, we looked out another month to the October options. On this day we could have bought the October 95 calls for $7.20. We could have sold the October 105 calls for $1.25. Our net out-of pocket cost for the spread would be $7.20 – $1.25, or $5.95 per share ($595 per contract). Here is the diagram:
Figure 3 – Apple Vertical Call Spread. Long 1 October 95 call, short 1 October 105 call
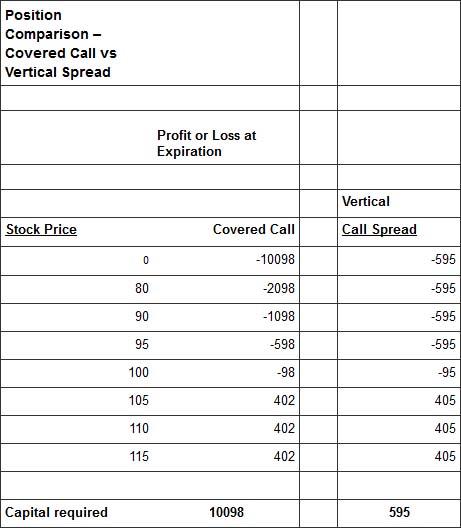
Comparing this diagram to the covered call diagram in Figure 1, we can see that part of it is quite similar. Both diagrams are pretty much the same at stock prices of $95 and higher. Here are comparisons at selected prices:
From the above table, we can see that the two positions would have almost identical results at any stock price above $95.
But if Apple were to take a big drop, the vertical spread would lose less. In the worst possible case, were Apple to become completely worthless, the difference would be very large. The covered call position would lose $10,098 in that case. By owning the Apple stock, we would have lost the entire value of it. This loss would be reduced a little by the call premium received. But if Apple fell far enough, the covered call position could still lose a very substantial amount.
The vertical call spread, by contrast would do much less badly in the event of a disaster. In that position, we would not own the Apple stock at all. Instead, we would just own a call option that gave us the right to buy the stock at $95. That call option would have cost us $720 for the 100-share contract, and we would lose all of that; but we would have in turn sold the $105 call to someone else. The sale of that $105 strike call option would have brought in $125, which we would get to keep. So our overall loss would be at most the $595 net of the two, even if Apple did become completely worthless.
If we know how to read the payoff diagrams, they tell this whole story quickly and graphically. We can see the similarities above $95. We can also clearly see that the P/L line in Figure 1 goes off the chart downward to the left (the sign of an unlimited-risk position) while the spread diagram in figure 3 levels out below a certain price (sign of a limited-risk position).
Where the spread chart levels out below a stock price of $95, we can see that the maximum loss is $595, and no worse. Note the last line in the comparison table: for each position, the capital required would be equal to the maximum loss: $10,098 for the covered call vs only $595 for the vertical spread. The covered call requires over 15 times as much capital to be tied up to make the same maximum profit, if we pay for the stock in full. In a margin account we could do the covered call for about half of that, but it is still a much larger amount. And we could get a margin call if Apple fell far enough. That could not happen with the spread.
Given a choice between these two positions, why would anyone choose the covered call? Why risk over $10,000 when $600 would seem to do the same job?
That’s a good question, and one that we might not have known to ask if the payoff diagrams didn’t put it in our face.
Before we even had the diagrams to compare, of course, we had to know that such positions existed and could be compared. That’s where a proper education like that offered in our classes comes in.
This content is intended to provide educational information only. This information should not be construed as individual or customized legal, tax, financial or investment services. As each individual's situation is unique, a qualified professional should be consulted before making legal, tax, financial and investment decisions. The educational information provided in this article does not comprise any course or a part of any course that may be used as an educational credit for any certification purpose and will not prepare any User to be accredited for any licenses in any industry and will not prepare any User to get a job. Reproduced by permission from OTAcademy.com click here for Terms of Use: https://www.otacademy.com/about/terms
Editors’ Picks
AUD/USD keeps the red below 0.6400 as Middle East war fears mount

AUD/USD is keeping heavy losses below 0.6400, as risk-aversion persists following the news that Israel retaliated with missile strikes on a site in Iran. Fears of the Israel-Iran strife translating into a wider regional conflict are weighing on the higher-yielding Aussie Dollar.
USD/JPY breaches 154.00 as sell-off intensifies on Israel-Iran escalation

USD/JPY is trading below 154.00 after falling hard on confirmation of reports of an Israeli missile strike on Iran, implying that an open conflict is underway and could only spread into a wider Middle East war. Safe-haven Japanese Yen jumped, helped by BoJ Governor Ueda's comments.
Gold price pares gains below $2,400, geopolitical risks lend support

Gold price is paring gains to trade back below $2,400 early Friday, Iran's downplaying of Israel's attack has paused the Gold price rally but the upside remains supported amid mounting fears over a potential wider Middle East regional conflict.
WTI surges to $85.00 amid Israel-Iran tensions

Western Texas Intermediate, the US crude oil benchmark, is trading around $85.00 on Friday. The black gold gains traction on the day amid the escalating tension between Israel and Iran after a US official confirmed that Israeli missiles had hit a site in Iran.
Dogwifhat price pumps 5% ahead of possible Coinbase effect

Dogwifhat price recorded an uptick on Thursday, going as far as to outperform its peers in the meme coins space. Second only to Bonk Inu, WIF token’s show of strength was not just influenced by Bitcoin price reclaiming above $63,000.
RECOMMENDED LESSONS
Making money in forex is easy if you know how the bankers trade!
Discover how to make money in forex is easy if you know how the bankers trade!
5 Forex News Events You Need To Know
In the fast moving world of currency markets, it is extremely important for new traders to know the list of important forex news...
Top 10 Chart Patterns Every Trader Should Know
Chart patterns are one of the most effective trading tools for a trader. They are pure price-action, and form on the basis of underlying buying and...
7 Ways to Avoid Forex Scams
The forex industry is recently seeing more and more scams. Here are 7 ways to avoid losing your money in such scams: Forex scams are becoming frequent. Michael Greenberg reports on luxurious expenses, including a submarine bought from the money taken from forex traders. Here’s another report of a forex fraud. So, how can we avoid falling in such forex scams?
What Are the 10 Fatal Mistakes Traders Make
Trading is exciting. Trading is hard. Trading is extremely hard. Some say that it takes more than 10,000 hours to master. Others believe that trading is the way to quick riches. They might be both wrong. What is important to know that no matter how experienced you are, mistakes will be part of the trading process.


