Today we’ll extend the example of a Calendar Spread that I started in last week’s article. These spreads are also known as time spreads or horizontal spreads. They consist of a long option (either put or call) at one expiration date; and a short option of the same type (put or call) at the same strike price, but at a nearer expiration date.
These profit from a difference in the rate of time decay between the short-term option (fast) and the longer-term option (slower). When they are done using the at-the-money strike price as in our example, they are neutral with respect to the price of the underlying. If a higher strike price is used, they are bullish, and with a lower strike, they are bearish.
Our example was using JNPR stock, which was at $26.44. We used calls at the $26 strike, buying the Aprils at $1.27 and selling the Marches at $.86, for a net debit of $.41.
Since the $26 strike price was a little below the $26.44 underlying price at the time, this trade had a slightly bearish bias. On calendars, the maximum profit is always made if the underlying ends up exactly at the strike price at the near-term expiration. In that case, our sold options expire worthless, while our long-term options still retain a lot of time value, now being the at-the-money options. It’s not necessary for the underlying to end up exactly at the strike price for us to make a profit (and really, how often would that happen?).
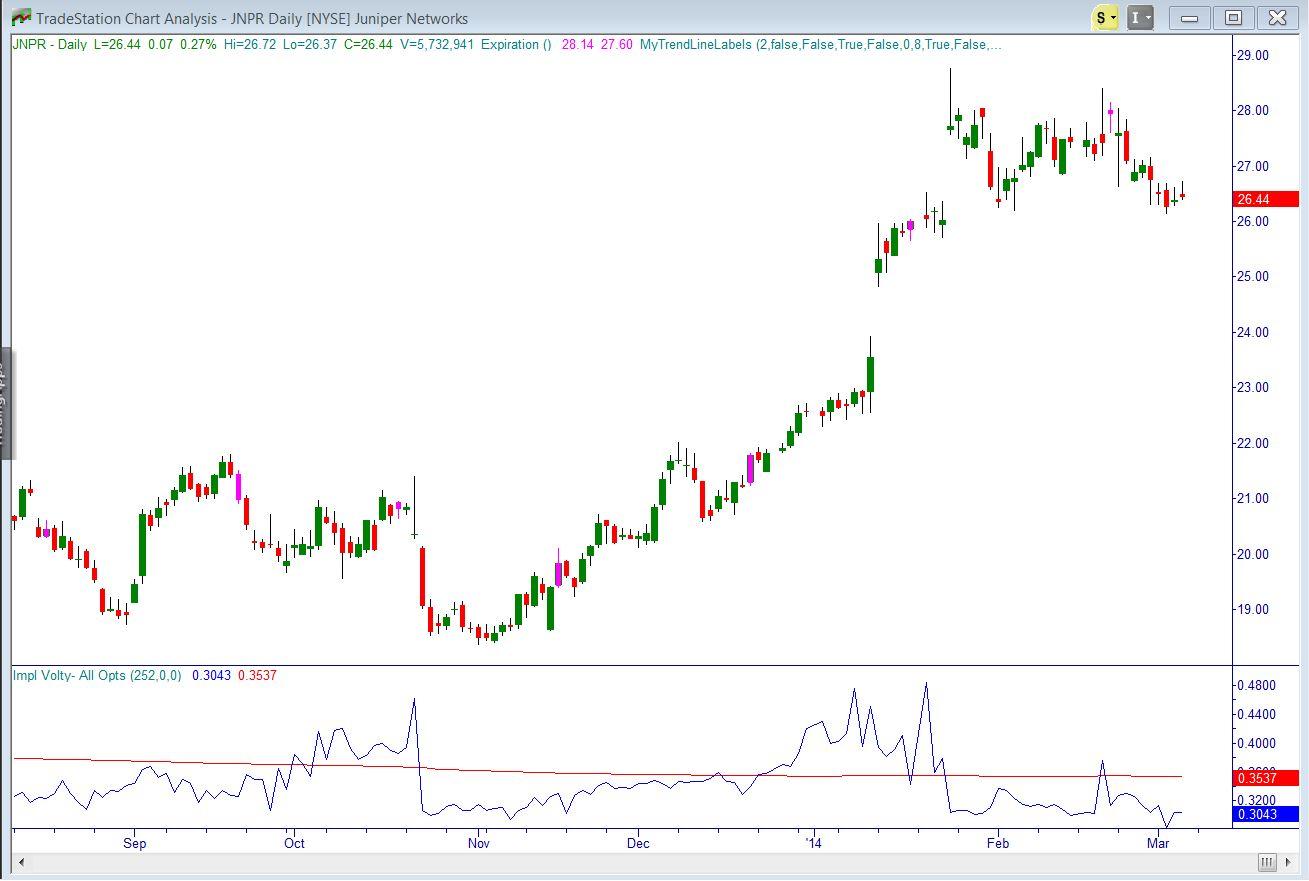
Here is the JNPR price chart as it appeared last week:
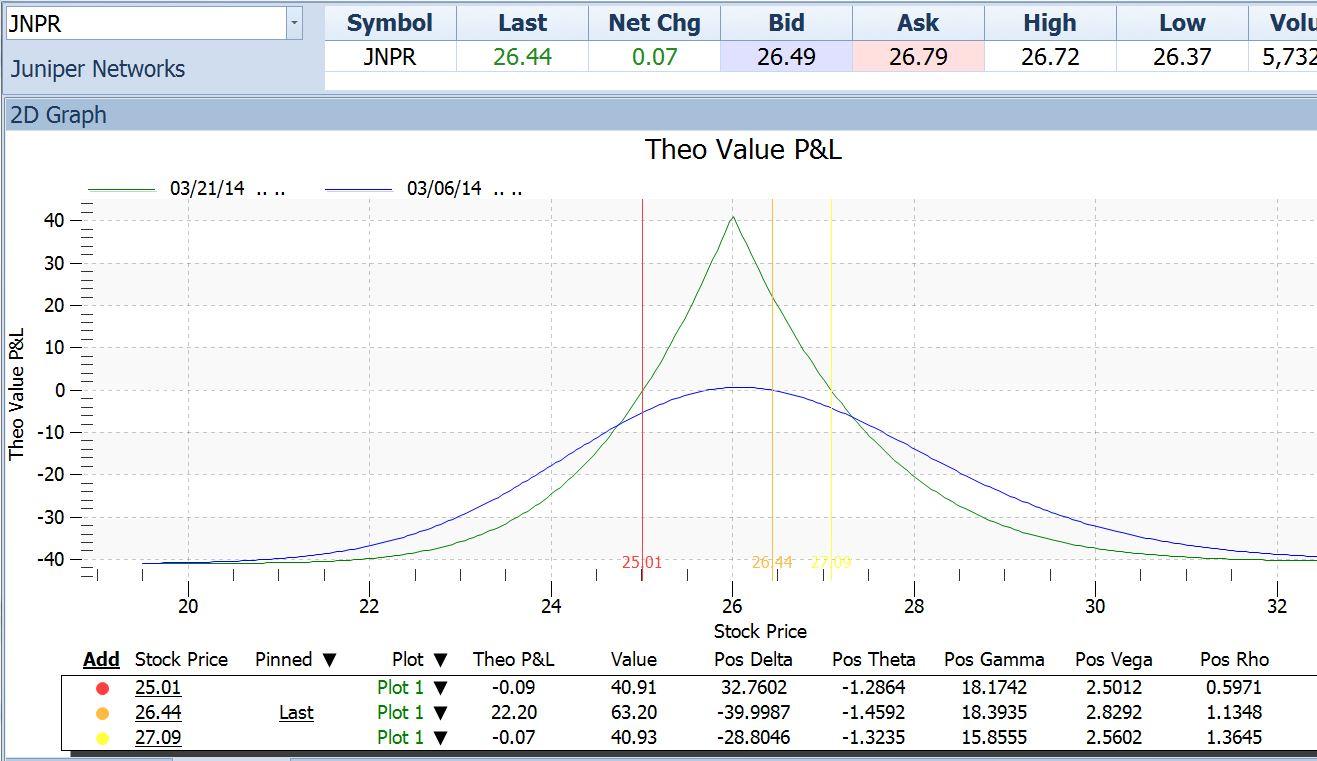
The profit/loss diagram for our calendar spread looked like this:
On the diagram above, we can see that the maximum profit (highest point on the curve, reading off the vertical scale at the left) was around $40; and this would occur at a stock price of $26 (reading off the horizontal scale at the bottom). The red and yellow vertical lines are placed so that they intersect the green P/L curve at the points where it crosses $0 profit, i.e. the break-even points. These were at $25.01 and $27.09. As long as JNPR stayed in that range until the March expiration, the trade would make a profit (assuming no change in implied volatility). If implied volatility increased, the whole P/L curve would move up. We thought that was likely, since implied volatility was very low.
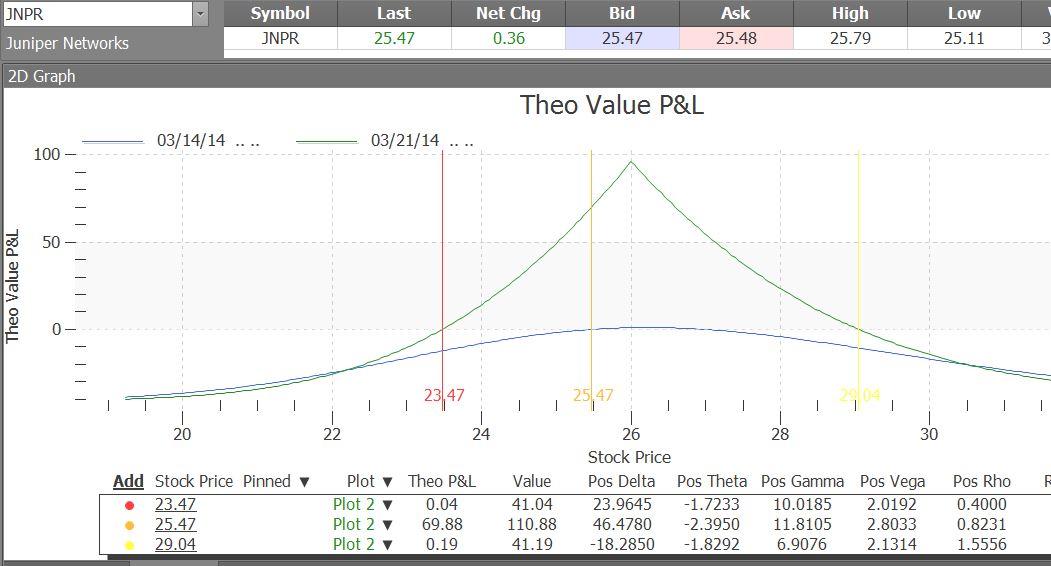
A week later, on March 13, JNPR had moved down close to $25.01 – our lower break-even point. However, a strange thing happened. When our stock reached the break-even point, it was gone. That lower break-even had moved down to $23.47. Here is the way the updated P/L diagram looked:
Because of a drop in price, implied volatility numbers had changed, and the change was favorable for us. The IV of our long April calls had increased more than that of our short March calls. Although the position coincidentally showed current open P/L of zero (the spread was still worth the same $.41 that we had paid for it a week earlier), our eventual P/L at any price was now better than it had been. At this point, we could afford to ride it out, as long as we did not think there was much chance of JNPR dropping below 23.47 at expiration.
What if JNPR did continue downward, so that the price moved out of our “profitability tent?” Could we improve our situation and avoid losses?
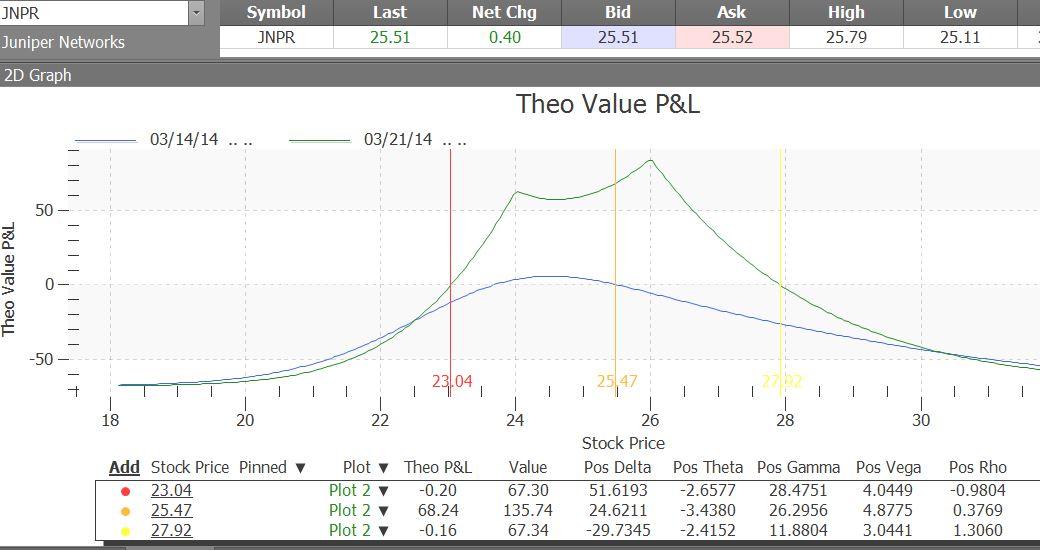
Yes, we can. One easy way is to pitch another pole in the tent. In this case, we could have bought another calendar spread – the March/April 24 put spread. This would involve buying the April 24 puts at $.33 and selling the March 24 puts at 7 cents. This would put another peak in our profitability tent at a price of 24. This would move our break-even down to 23.04, far below any price we expected within the next few days.
Here’s how the diagram looked after adding this second calendar:
We have managed to move the minimum price at which we can make a profit down considerably, at very little cost.
This is an example of evolving a position into one that works better in response to changing conditions.
Next time we’ll look at other examples of position evolution, using this trade and others.
This content is intended to provide educational information only. This information should not be construed as individual or customized legal, tax, financial or investment services. As each individual's situation is unique, a qualified professional should be consulted before making legal, tax, financial and investment decisions. The educational information provided in this article does not comprise any course or a part of any course that may be used as an educational credit for any certification purpose and will not prepare any User to be accredited for any licenses in any industry and will not prepare any User to get a job. Reproduced by permission from OTAcademy.com click here for Terms of Use: https://www.otacademy.com/about/terms
Editors’ Picks
EUR/USD clings to daily gains above 1.0650

EUR/USD gained traction and turned positive on the day above 1.0650. The improvement seen in risk mood following the earlier flight to safety weighs on the US Dollar ahead of the weekend and helps the pair push higher.
GBP/USD recovers toward 1.2450 after UK Retail Sales data

GBP/USD reversed its direction and advanced to the 1.2450 area after touching a fresh multi-month low below 1.2400 in the Asian session. The positive shift seen in risk mood on easing fears over a deepening Iran-Israel conflict supports the pair.
Gold holds steady at around $2,380 following earlier spike

Gold stabilized near $2,380 after spiking above $2,400 with the immediate reaction to reports of Israel striking Iran. Meanwhile, the pullback seen in the US Treasury bond yields helps XAU/USD hold its ground.
Bitcoin Weekly Forecast: BTC post-halving rally could be partially priced in Premium

Bitcoin price shows no signs of directional bias while it holds above $60,000. The fourth BTC halving is partially priced in, according to Deutsche Bank’s research.
Week ahead – US GDP and BoJ decision on top of next week’s agenda

US GDP, core PCE and PMIs the next tests for the Dollar. Investors await BoJ for guidance about next rate hike. EU and UK PMIs, as well as Australian CPIs also on tap.
RECOMMENDED LESSONS
Making money in forex is easy if you know how the bankers trade!
Discover how to make money in forex is easy if you know how the bankers trade!
5 Forex News Events You Need To Know
In the fast moving world of currency markets, it is extremely important for new traders to know the list of important forex news...
Top 10 Chart Patterns Every Trader Should Know
Chart patterns are one of the most effective trading tools for a trader. They are pure price-action, and form on the basis of underlying buying and...
7 Ways to Avoid Forex Scams
The forex industry is recently seeing more and more scams. Here are 7 ways to avoid losing your money in such scams: Forex scams are becoming frequent. Michael Greenberg reports on luxurious expenses, including a submarine bought from the money taken from forex traders. Here’s another report of a forex fraud. So, how can we avoid falling in such forex scams?
What Are the 10 Fatal Mistakes Traders Make
Trading is exciting. Trading is hard. Trading is extremely hard. Some say that it takes more than 10,000 hours to master. Others believe that trading is the way to quick riches. They might be both wrong. What is important to know that no matter how experienced you are, mistakes will be part of the trading process.


